Discussion Paper
Scaling Circular Solutions in Healthcare



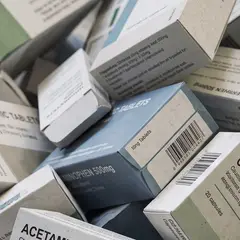




Healthcare’s next circularity challenge lies in the products it designs, uses and discards every day: packaging, single-use devices and MedTech equipment. Recovering the value in them is a business opportunity. The technologies and partnerships to close the loop exist today; what is missing is scale, data, and coordination.

Why this discussion paper, and why now
Material innovation has advanced the healthcare sector and patient care significantly over the last decades. But the sector is also one of the most resource-intensive industries. The value of these resources is lost at end of product life, while a significant share would be recoverable through circular strategies, if segregated at the point of use. Systemic costs are high. The industry's own producers, the companies that design and manufacture packaging, single-use devices and MedTech equipment, sit at the one point in the system with the power to change that.
Waste volumes are growing and <5% of clinical plastic is recycled today; most is incinerated or landfilled[1].
The system leaks value because four actors, patients, producers, providers and payers, each optimise for their own constraint, with no shared data or incentive to align them. Patients want safety above all. Producers design and profit, but lose control the moment a product leaves the factory. Providers use and dispose, but can't redesign what they're handed. Payers fund the system, but reward low unit cost over lifecycle value. This discussion paper is written from the producer's seat, because producers hold the levers that shape a product's environmental and economic footprint both before and after it reaches a patient: how it is designed, the business model it is sold under, the services that keep it in use after the sale, and the partnerships and ecosystem that bring it back.
This discussion paper is not a sustainability narrative. It's a proposition to uncover and recover value.
It is a business case, and a strategic view of the pathways toward a more circular healthcare business. It argues that circularity in healthcare is now a commercial strategy, not a compliance cost. But Packaging, Single-use devices and MedTech capital equipment each face that opportunity on different timelines and through different constraints, so a single strategy will not serve all three. Scaling beyond pilots requires specific, sequenced moves.




| Section | What it covers |
|---|---|
| 01 The linear trap | Opens the case in full: the scale of the problem, the four-actor misalignment, and why packaging, SUD and MedTech each carry the opportunity differently. |
| 02 Circular levers & value | Quantifies it: three levers (Rethink & Reduce; Reuse, Reprocess & Refurbish; Recycle) and the seven business value drivers they move, weighted differently in each vertical. |
| 03 Packaging, SUD & MedTech | The operating core of the discussion paper: each vertical is read first through the same five lenses — regulation and legislation, infrastructure, market, supply chain and operations, and technology — and then turned into Calls to Action across governance, design, data and ecosystem, split into internal moves a producer controls directly and external moves that require partners, most of them backed by a real case study. |
| 04 Scaling systemically | Steps outside the present and asks what if the 2040 reality is more radical than we all think: eight projections the sector already publishes — on demography, the shift of care into the home, rising single-use volumes, the workforce gap, product-level data, climate and supply-chain geopolitics, the cost of single-use and automated production — and the shape of the system that survives them, one in which material, information and financial flows reconnect and the value circularity creates is shared with providers, payers and patients. |
The ask. This discussion paper is meant to inspire decisions. Every Call to Action in section 03 is written to be actionable inside a producer's own operating model to recover value through circular strategies.
The technology and the partners to close the loop already exist. It requires the pioneers to move from pilot to scale.
If you have ideas or feedback that could help advance this discussion, we'd welcome the conversation — please reach out and get in touch.

Healthcare's linear trap and the circular opportunity
The healthcare industry has made remarkable progress in recent decades in fulfilling its core purpose: protecting human life. Yet the industry faces a contradiction. Its high resource consumption and substantial waste generation put pressure on the environment that human health depends on.
The healthcare industry mainly runs on a linear, take-make-dispose model. The value chain extracts raw materials, processes them into products, uses each one once, and discards it — a pattern repeated across billions of individual moments of care, from a single syringe to an entire imaging suite retired years before its components actually wear out. That model was economically rational when fossil fuel-based polymers were cheap, global supply chains were stable, and the cost of disposal and emissions sat outside anyone's balance sheet.
None of those conditions hold today: virgin material costs are rising and volatile, supply chains have proven fragile under real disruption, and regulation is actively pricing the externalities that used to be free. A model built for a world of cheap, abundant, consequence-free inputs is increasingly operating in the opposite world, and every actor in the system is absorbing that mismatch as cost, risk, or waste.
None of this happens because any single actor is acting in bad faith. Value is lost where responsibility changes hands, and those losses show up in different ways. Single-use manufacturing is energy-intensive, capital equipment is retired with years of useful life left, and clean, recyclable plastics are incinerated daily because they’re misclassified as hazardous waste. No single actor sees the full extent of these losses or has enough incentive to prevent them. Each of the four stakeholders is working towards a different goal, and there’s no shared system that connects the consequences of one actor’s decisions to the incentives of the next.
Design & make
Producers & Brand Owners
Design product and packaging — determining most of the product's lifetime footprint — but lose control at the point of sale.
Use & dispose
Providers & users
Hospitals and clinicians control use and disposal — but can't redesign products or reroute materials.
Health first
Patients
Want to get and stay healthy. Safety and outcomes come first — circularity must never add clinical risk.
Fund & reward
Financing & insurers
Payers fund the system — but reward low unit cost, not lifecycle value or circular outcomes.
Why producers are best placed to change the system. The OEMs and brand owners that design and sell packaging, single-use devices and capital equipment hold more of the levers than any other actor.
- They decide what a product is made of and whether it can be repaired, reprocessed, refurbished or taken apart — a widely cited, if debated, estimate puts up to 80% of a product’s environmental impact at the design stage[113][9].
- They decide the business model it is sold under, and with it whether value is earned once at the point of sale or across the product’s whole life.
- They design the services that follow the sale — maintenance, upgrades, take-back and certified second life.
- They are the indispensable party in the partnerships needed to collect and sort products at the point of use: no collection or recovery ecosystem works at scale without the producer’s product data, regulatory approvals and commitment. But collection happens inside the hospital, under the hospital’s waste licence and by its staff, so producers cannot convene it alone. A single producer can run a take-back programme for its own products; a shared bin needs a neutral orchestrator (§3.2.2, call 05).
- The capacity to invest in change sits largely with them.
Infection control, patient safety and cost determine what’s possible for circularity in healthcare, from how products are designed to how hospitals use and dispose of them. Hospital staff work under time pressure, and infection prevention protocols favour single-use products and treating waste as hazardous whenever there’s doubt. Procurement teams prioritise low unit prices and simple processes, so the value a product offers over its lifetime carries less weight. For manufacturers, changing a material, adding recycled content or extending a product’s life can trigger years of costly requalification under MDR, FDA or EMA requirements. These constraints exist for good reasons and help explain why circular solutions can work technically and still stall in practice. To scale, they need to meet safety and cost requirements from the start.
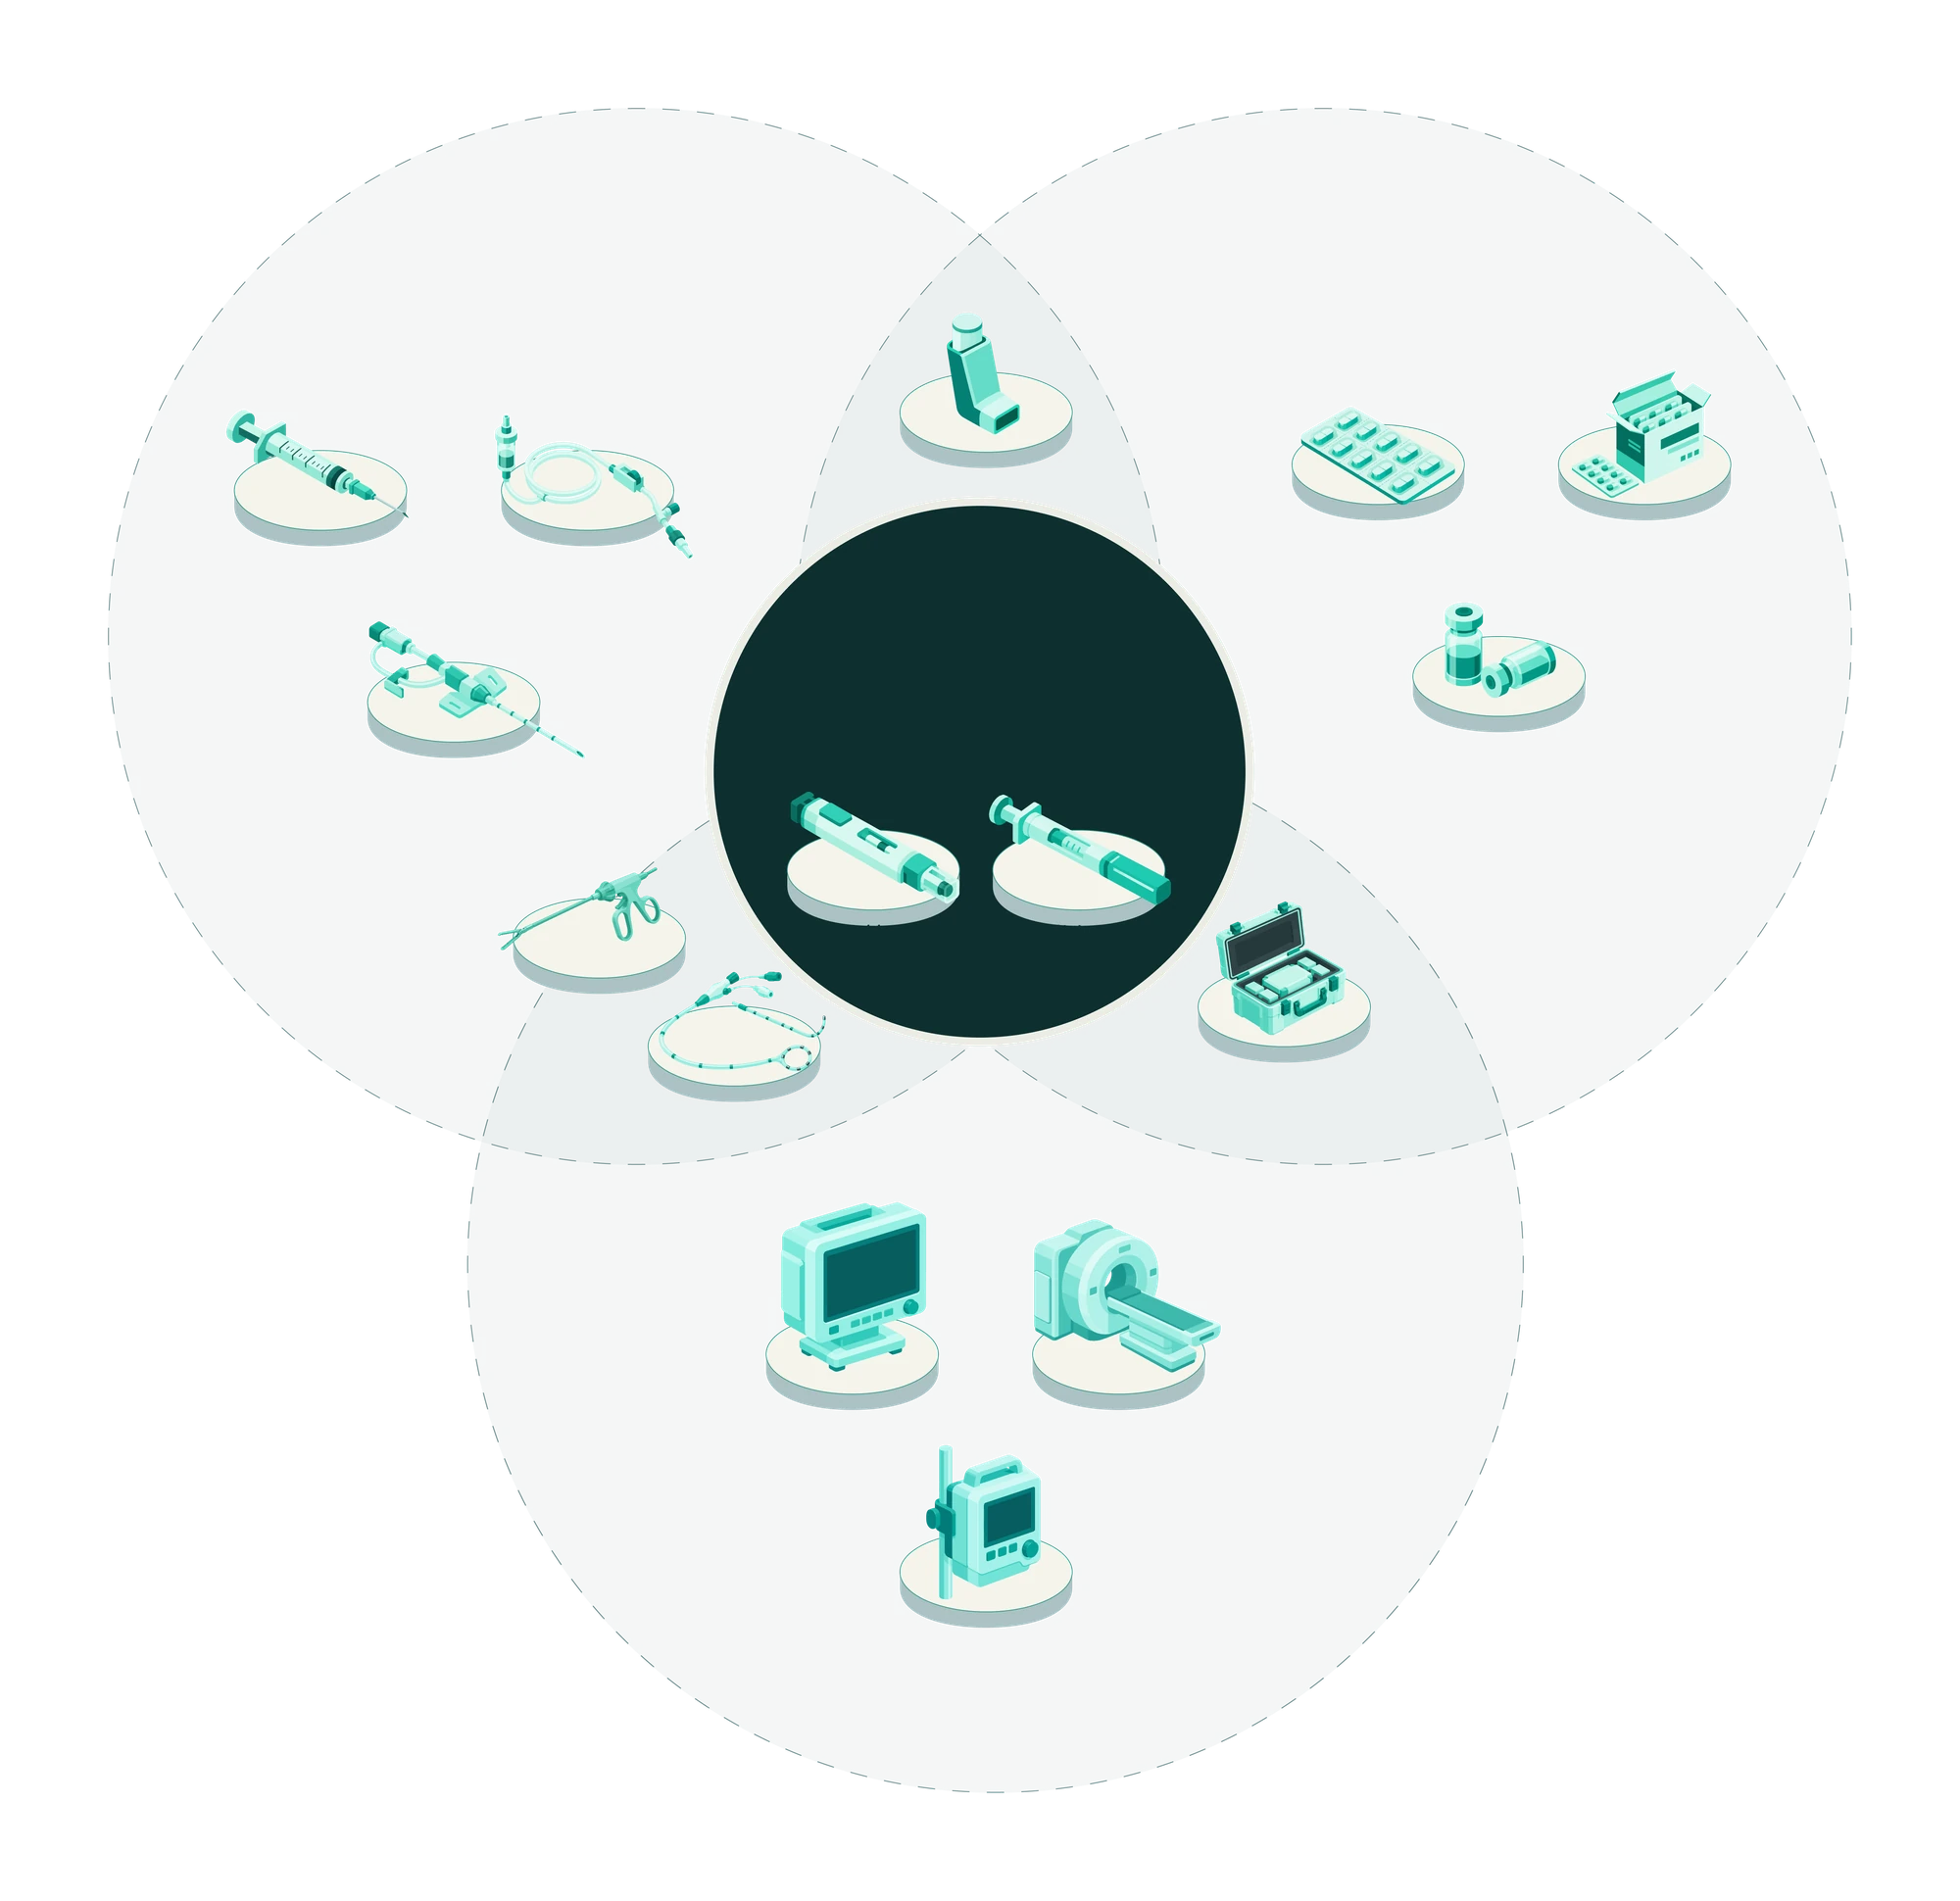
Healthcare products are diverse and don't sit in silos. They don't face equal barriers to circularity. Three verticals make the spectrum concrete — packaging, single-use devices and MedTech — and where they overlap is where the linear model breaks down hardest.
Think of it as a constraint spectrum: the closer a material sits to the patient or the active ingredient, the tighter the regulation and the longer the road to circularity.
| Vertical | What it covers | Circularity challenges |
|---|---|---|
| Packaging | Primary, secondary and transport formats for drugs and devices. | Multi-material, sterility-critical formats are hard to recycle, and that technical constraint now collides with a fast-moving, fragmented set of rules worldwide. |
| Single-use devices | Single-use polymer devices, procedural instruments and diagnostics. | Devices are often designed and commercially protected for single use, OEM proprietary locks and GPO contract terms have historically resisted third-party reprocessing, and regulatory liability for reprocessing safety still varies sharply by region. |
| MedTech | Instruments, imaging and monitoring equipment. | High-value equipment often loses value at end-of-use and OEMs have limited visibility of their own installed base. Right-to-repair restrictions and OEM's control of parts, software and diagnostics keep hospitals and independent servicers locked out. |
 Single-use devices
Packaging
MedTech
Sterile barrier
Reprocessed
Reusable cold-chain
Syringe
IV tubing
Catheter
Laparoscopic
instrument EP catheters Inhaler Blister Cartons Vials Auto-injectors Pre-filled syringes Reusable shipper Monitor Imaging Infusion pump Combination products Highest regulatory
complexity
Single-use devices: syringe, IV tubing, catheter
Packaging: blister, cartons, vials
MedTech: monitor, imaging, infusion pump
Sterile barrier: inhaler
Reprocessed: laparoscopic instrument, EP catheters
Reusable cold-chain: reusable shipper
Combination products (highest regulatory complexity): auto-injectors, pre-filled syringes
Regulation draws clear lines between packaging, MedTech and pharmaceuticals but in practice, those lines can run through the same product. A pouch for a sterile medical device is both packaging and a sterile barrier under ISO 11607. A reusable cold-chain shipper serves as packaging but can be managed as a MedTech capital asset. A prefilled syringe combines a drug, a delivery device and primary packaging in a single product subject to overlapping regulatory requirements.
Of course, circularity in pharma can go broader than these product verticals. For example, medicinal drug products, APIs and excipients, or green chemistry are important themes that go beyond the scope of this paper. Similarly, we do not address water reuse or solvent and ethanol recycling, as we focused mainly on the material flows embedded in products and packaging.

Circular Levers, and the value they create
The circular economy (CE) is not a sustainability aspiration; it is an operational and commercial strategy. It encompasses a broad spectrum of business interventions — from product redesign (designing for disassembly, repairability, and recyclability) to new business models (Product-as-a-Service, take-back programs) to end-of-life recovery (reprocessing, refurbishment, recycling). Circular economy connects the economic imperative with resource efficiency.
As pressure grows, the companies and health systems that respond by building circularity into their decisions today will shape how the rest of healthcare designs, buys and uses products over the next decade.
Circularity in healthcare has diverse strategies: refuse, replace, rethink, reduce, reuse, maintain, repair, refurbish, remanufacture, repurpose, recycle, renew and recover (see Hoveling et al.'s Circular Healthcare Flows taxonomy) [12]. We build on that taxonomy and the impressive work of the DiCE project[13], and cluster the ones a producer can act on commercially into three levers, split by what the producer actually changes. Rethink & Reduce covers refuse, replace, rethink and reduce: either changing the commercial model altogether — outcome-based contracts, Product-as-a-Service, leasing — so that revenue no longer depends on units shipped, or reducing the need for production some other way, through elimination, substitution, dematerialisation and design. Reuse, Reprocess & Refurbish covers reuse, maintain, repair, refurbish, remanufacture and repurpose: everything that keeps a product in use for longer through multiple use, whether the user simply refills it, the manufacturer repairs it, or a specialist reprocesses and resells it. Recycle covers recycle, renew and recover: the product does not survive, only the material does.
Rethink & Reduce
Change the commercial model itself — or design the need for production out before anything is made.
- Outcome-based models and Product-as-a-Service
- Leasing, rental and managed-service contracts
- Elimination of use — refuse what is not needed
- Dematerialisation (e.g. electronic patient information leaflets)
- Material substitution — recycled content, renewable, low-carbon and fibre-based materials, low-emission plastics and bioplastics, biodegradable and compostable formats
- Design innovation — recyclability, right-sizing, material reduction, mono-material, light-weighting
Reuse, Reprocess & Refurbish
Products stay in use for longer through multiple use.
- Return & reuse ecosystems; refillable systems
- Reuse of transport and cold-chain packaging
- Reprocessing of validated single-use devices
- Refurbishment, remanufacturing & certified resale
- Repair, maintenance & service-life extension
- Component-level restoration: restore the surface, keep the part
- Redistribution and donation of functional equipment
Recycle
Materials are recovered at maximum efficiency once no further use of the product itself is possible.
- Mono-material design for recovery (blisters, pumps)
- Dedicated take-back systems & recycling streams
- Upcycling into new applications
- Spare-part harvesting and component recovery
- Advanced sorting and mechanical recycling for efficient plastics recovery
- Chemical recycling for hard-to-recycle plastics
The three levers apply everywhere — but what they're worth, and to whom, changes completely across the three verticals.
Packaging is driven largely by cost and tender criteria. Margins are thin, material costs are visible on every invoice, and the EU's PPWR is making recyclability a scored procurement criterion, so Cost and Tenders carry the most weight. Reuse applies here as well, but mainly in controlled B2B formats such as transport shippers, totes and cold-chain boxes, which circulate within the supply chain rather than in clinical use. Its value therefore tends to show up in Cost and Supply Chain Resilience before it is reflected in a tender score.
Single-use devices sit between infection-control requirements, the economics of reuse and the availability of scalable recycling systems. For whoever operates the reprocessing, Revenue and Supply Chain Resilience are the clearest drivers. Take-back and recycling, by contrast, tend to support Customer Loyalty and Licence to Operate.
MedTech capital equipment is the vertical in which circularity is already an established, monetised product line, and in which the distinction between the first two levers is clearest: Product-as-a-Service changes how the equipment is sold, certified refurbishment changes how long it stays in service. Both point primarily to Revenue, Supply Chain Resilience (given exposure to critical raw materials) and Customer Loyalty through long-term service contracts, which in this vertical can weigh more heavily than direct cost savings.
For producers, circularity is a relevant business case in its own right, not only a regulatory requirement. The value shows up across seven business value drivers — cost, revenue, supply chain resilience, customer loyalty, tenders, patient experience & safety, and licence to operate. These form the rows of the heatmap below.
Mapping the three circularity levers (columns) against the seven business value drivers (rows) — filtered by vertical — makes the pattern above concrete. Darker cells mean the lever is a stronger driver of that value. Where the business value is low or the lever barely applies, the cell is faded out and left blank deliberately — so the signal stays visible. Click any faded cell to read why it scores low. A few cells per vertical also pose a question: a hypothetical worked example of what that lever might be worth at realistic scale. Press the ? to see the assumptions we would have to make for the answer to be yes.
All calculation examples in this heatmap are purely hypothetical and need to be verified in specific contexts with primary data. They do not qualify for citation. Cell shading is the authors' own illustrative classification based on public information as of 2026.
This is a vibrant space. We identified more than 80 circularity initiatives publicly announced over the last five years. Because this review only captures initiatives that have been launched publicly, it does not include the many pilots still being tested behind the scenes.
Overall, there is a high degree of collaboration happening in this space. Just over a third of the initiatives we reviewed have a partnership or consortium as the main driver. The highest degree of collaboration is happening in packaging, where just over half of initiatives are driven by a partnership of changemakers.
Packaging accounts for the largest share of initiatives. This has an emphasis on either rethinking packaging design or recycling. This also does not capture the many initiatives companies have started as part of their own circular-transition programmes (for example, increasing recycled content in a specific packaging type). Single-use devices make up a significant share as well, and MedTech, while still the smallest of the three, is no longer a marginal presence at close to one in five tracked initiatives.
Many initiatives are moving now from pilots to a more scaled approach. Only few have reached industrialised stage. We categorised an initiative as beyond pilot stage if the offering or solution moved into a programmatic approach, became a standard offer, or was replicated across more products or regions.
So what makes a pilot successful and helps it move up in scale? E.g. more products, more regions, higher volumes, more partners, etc.? There is no single answer, but a few patterns stand out (more details in the dedicated deep dive sections below).
| Vertical | What is helping pilots scale |
|---|---|
| MedTech | MedTech remains the smallest product area in the data set, but the pattern still holds: all but one of its tracked initiatives have already moved beyond pilot stage, and three in four centre on refurbishment, resale or rental as the central lever — a high per-unit product value seems to be a good prerequisite for monetising extended product lifecycles. |
| Single-use devices | Although single-use devices is a challenging area to solve, the pressure to act means many pilots are scaling on the strength of ambition and collective energy behind the programmes. |
| Packaging | Especially in packaging, regulatory pressure from the PPWR and other policy mechanisms is helping initiatives around design for recycling and recycled content to scale, which in turn supports market and infrastructure development around recycling. |
Pilots often deliver important learnings for scaling. Hence it is important to note that, even if a pilot is discontinued, its learnings support other initiatives, or complete projects are carried forward in different set-ups. For example, the inhaler recycling pilot by GSK was rolled into Chiesi's Take-Back programme, which is now run by CiPPPA.
Full initiative list
Hover over a row for a preview, then click to see the full details below the table.
Position = product area (column) × circularity lever (row). Click any initiative for details. Discontinued initiatives are shown inline, tagged "discontinued" — filter to isolate them, or to compare pilot vs. scaling activity by area.

Scaling circular solutions in packaging, single-use devices, and MedTech
Tighter regulation, growing demand and better infrastructure are increasing the expectation that healthcare will find ways to adopt circular solutions while meeting patient safety and infection control requirements. The pace of change and the barriers to scaling differ across packaging, single-use devices and MedTech. We use the same five lenses to compare global trends and assess what it will take to scale circular solutions in each area.
Understand the global trends and developments for circular solutions
- A. Regulation & Legislation
- B. Infrastructure
- C. Market
- D. Supply Chain & Operations
- E. Technology
Derive Calls for Action to scale solutions in the specific product vertical
- Internal actions
- External actions
What follows takes each of the three verticals in turn — Packaging, SUD and MedTech — and shows how it currently operates across these five dimensions. Each vertical then translates that picture into a set of Calls to Action, built on real case studies and early success stories, showing how the same dimensions that constrain a vertical today can be turned into enablers of a more circular offering.
Packaging

Healthcare packaging protects product integrity and communicates safety information. It also contributes to healthcare plastic waste, although its share varies by product, care setting and waste-management system. Patient safety and packaging function are non-negotiable, and healthcare depends globally on high-performance and quality materials, complex structures of plastic and fibre-based packaging. The system is materially exposed to the consequences of a linear material model, especially on plastics: dependence on virgin materials, complex multi-material and multi-component formats that are difficult to sort and recover; uneven collection and sorting infrastructure across geographies and fragmented regulatory rules that are shifting from only waste management towards full lifecycle accountability.
where the journey breaks
An illustrative, simplified map of how packaging moves — not a measured or universal sequence. Hover or click a marker to reveal actions for closing each gap.
 Raw materials
 Material supplier
 Converter
 Design
 Test / pilot
 Production
 Transport / distribution
 Pharmacies
 Consumer use
 Hospital
 Collection
 Sorting
 Recycler
 Incineration
 Landfill
 Leakage
Co-industrialise upstream with materials suppliers and converters. Align specifications, investment and the recovery infrastructure needed to operate at scale.
Start by eliminating unnecessary packaging before substituting materials. Protect clinical function and product safety while designing for sorting and recycling, with future requirements in mind.
Begin in regions where collection and processing capability exists. Coordinate hospitals, waste partners and recyclers, then expand the network through partnerships.
Mechanical recycling cannot meet every healthcare quality requirement, and advanced recycling is a group of processes with different accepted inputs, yields, safety and environmental performance. Validate the route that fits each material, and keep material-to-material recycling distinct from fuel production or energy recovery.
Repacking, relabelling and related practices generate both non-contaminated and contaminated packaging waste. Identify these material flows and improve separation and recovery where appropriate.
Enable regulated consumer returns through pharmacies, with clear responsibilities, safe handling and collection routes.
Packaging can escape regulated collection after consumer use. Improve convenient collection access and clear return instructions to reduce leakage.
Establish ownership and decision traceability across functions, define repeatable decision processes and commit the budget needed to scale circular packaging.
Build a living evidence and exposure record across packaging hand-offs, from suppliers and manufacturing to use, collection and recovery, so decisions can be supported by shared data.
The EU's Packaging and Packaging Waste Regulation illustrates that direction of travel: packaging requirements now extend across design, composition, reuse or recoverability and waste management, not disposal alone[33]. That is why packaging circularity cannot be managed as a single requirement; the complexity and implications of current decisions should consider the patient and consumer, clinical risk, cost, market access and regulatory exposure at once.
Getting that decision wrong creates two opposing forms of risk. On one side, a failure to protect sterility, barrier performance, traceability, compatibility or correct use can have serious patient-safety consequences, and lead to recalls, disrupted availability, regulatory exposure and loss of trust. On the other, maintaining the status quo without a credible transition path can expose a business to rising material costs, higher or modulated EPR fees, constrained market or tender access, supply risks for specific materials, avoidable Scope 3 emissions, and packaging that cannot be recovered in the markets where it is placed. How large each exposure is varies by product, market, distribution, regulatory and commercial pathways; none can be equally applicable to every producer.
Whatever the packaging material, clinical performance is non-negotiable. A change in material only makes sense if it preserves that performance and helps reduce avoidable material use, toxicity, waste and supply chain dependency. Regulatory and commercial pressure to cut packaging waste has grown quickly, reinforced by rising expectations from customers, patients and the public. Packaging has always had to deliver sterility, safety and quality. Now the choices that procurement and engineering have traditionally made also affect compliance, business resilience and market access, making packaging a strategic decision for the wider business, including finance and operations.
Global packaging trends and developments
Packaging regulation & legislation
Pressure to reduce packaging's environmental impact is rising worldwide, but how it reaches healthcare varies by jurisdiction and by pack. The EU's PPWR is the most comprehensive framework and is becoming the global benchmark: it applies to healthcare packaging, with targeted exceptions for some medicinal and device packaging from the design-for-recycling and recycled-content requirements, while substance, conformity and producer-responsibility obligations still apply. Elsewhere, producer responsibility is the main lever: long established in Japan, in place in several provinces in Canada, spreading state by state in the United States, often with drug and device exclusions, still maturing across Latin America, and uneven across APAC, where Australia has shelved a national scheme. Jurisdictions are converging on the principle of producer responsibility while diverging on the instruments. For healthcare producers, the question is less whether rules apply than which ones apply to each component in each market, and whether they hold the data to prove compliance.
Simplified overview, not a legal inventory. Hover over, tap or tab to a label for detail and sources.
Environmental rules add to, not replace, product-safety rules. Meeting a packaging sustainability rule never relaxes the rules that protect the medicine or device: containers must still be compatible and keep the product stable, and device packaging must still keep its integrity[33][180][181]. The reverse also holds: a pack exempted from one environmental target, such as recycled content, may still have to be reported and paid for under EPR. In practice, each component (blister, carton, pouch, shipper) has to be assessed on its own, per market and sales channel, because obligations can change with the company's role (manufacturer, brand owner or importer) and with whether the pack ends up in households or hospitals[182].
On 12 August 2026, the PPWR replaced the former Directive with rules that apply directly across the EU. They cover substances, design for recycling (DfR), recycled content, packaging minimisation, labelling, reuse and extended producer responsibility (EPR), with requirements phased in towards 2030 and 2035[17][33].
Read more on EU
- Evidence is needed now. Conformity assessment, technical documentation and supplier information are required even where redesign deadlines come later[183][184].
- Healthcare exemptions are limited. Immediate medicinal packaging, contact-sensitive packaging for medical devices and in vitro diagnostics, and some outer packaging that preserves product quality are exempt from DfR and recycled-content requirements. Substance, conformity and EPR duties still apply[33][152].
- The impact varies by sector. For pharma and biotech, the rules mainly affect cartons, leaflets and shippers. For medical devices and MedTech, they mainly affect secondary and transport packaging, with limited relief for custom transport packaging. OTC and consumer health face the broadest exposure. Food supplements fall outside the medicinal packaging exemptions and are subject to the PFAS limits for food-contact packaging[33].
Which rules apply depends on what each part of the packaging does. For medical devices, packaging changes still need to go through formal change control[152][156].
Across all three sectors, the PPWR will affect access to the EU market and add EPR costs for all packaging. Companies will need data on each packaging component for EPR reporting and for each Declaration of Conformity. Beyond the EU, the PPWR is setting a benchmark for sustainable packaging[33].
There is no single model in the rest of EMEA. Switzerland, the UK, the UAE and South Africa each take a different approach, from established EPR combined with a plastic packaging tax to a temporary EPR pilot.
Read more on Rest of EMEA
- Switzerland. A new Packaging Ordinance (VerpV), adopted by the Federal Council on 24 June 2026, enters into force on 1 January 2027 and replaces the 2000 ordinance on beverage packaging, with further obligations phased in to 2032. For the first time it covers all packaging and introduces producer responsibility. It relies largely on reporting duties, fees and conditional measures that tighten only if voluntary industry targets are missed, rather than on the PPWR’s fixed recyclability grades and recycled-content quotas. A producer with Swiss manufacturing faces the VerpV at home and the full PPWR on anything it places on the EU market[227].
- United Kingdom. EPR is already up and running. From April 2026, a Plastic Packaging Tax of £228.82 per tonne also applies to plastic packaging with less than 30% recycled content. The immediate packaging of licensed human medicines is exempt from the tax, but that exemption does not automatically cover devices, diagnostics or secondary packaging[185][186][187].
- United Arab Emirates. Packaging EPR is so far only a temporary pilot in Abu Dhabi and Dubai[188][189].
- South Africa. EPR is in place, with fees based on weight and recyclability. An exclusion for pharmaceutical packaging has been proposed but not yet confirmed[190][191].
In the United States, packaging regulation comes from individual states through EPR laws rather than from federal rules. Canada combines federal data collection with provincial EPR.
Read more on North America
- Seven US states have passed packaging EPR laws[19][20], and they are at different stages. Oregon and Colorado are already operating, and California’s fees start in 2027. Maryland, Minnesota and Washington are still setting up their schemes[171], and Maine has not yet appointed a stewardship organisation[153].
- Requirements vary from state to state. Reporting rules differ[170], and more states have bills in progress[21]. Healthcare coverage varies too: Oregon and California exclude much drug and device packaging, but not all of it[192][193][194][195][196]. Oregon’s law has held up in court so far, although an appeal is likely[22][154].
- Federal quality rules still apply. Whatever a state’s EPR scope, federal rules on containers, packaging changes and device packaging continue to apply[180][197][181].
- Canada. The federal Plastics Registry collects data, while the provinces run EPR. In Ontario, producers have been fully responsible for Blue Box materials since the end of 2025[198][155][182].
Together, these laws shift end-of-life costs onto producers, which adds pressure to cut packaging weight and improve recyclability.
In APAC, packaging rules rarely single out medicines or medical devices, so whether healthcare packaging is covered has to be checked in each market.
Read more on APAC
- China. The Ecological and Environmental Code, in force since 15 August 2026, requires packaging to be reasonable and sets up recovery based on a catalogue of covered products. Its limits for food packaging do not automatically apply to medicines or devices[199].
- India. Plastic packaging EPR applies to pharmaceutical and device packaging. Relief from recycled-content requirements is only granted where the law prevents the use of recycled material, and biomedical waste is covered by separate rules[200][201][202].
- Japan. Packaging EPR has been in place for a long time, but it targets household consumption, so containers used and thrown away only in hospitals are not covered[172][203][204].
- Australia. A planned national scheme has been shelved, so existing co-regulatory arrangements stay in place[174][205].
In Latin America, packaging regulation is arriving mainly through EPR schemes that are still maturing, and whether healthcare is covered differs by country[176].
Read more on LATAM
- Brazil. Decree 12,688/2025 sets up reverse logistics for plastic packaging, with recycled-content obligations from 2026. It excludes packaging covered by the separate decree on household medicines, and ministry guidance includes healthcare products other than medicines[206][207][208].
- Chile. Targets have applied since September 2023, with no general exemption for medicines, devices or diagnostics[209].
- Colombia. Resolution 803/2024 explicitly excludes packaging for medicines and hazardous waste[210].
- Mexico. The General Law on Circular Economy, published in January 2026, phases in a national EPR framework[176].
Producers should map the rules market by market, rather than assume that one country’s exclusions apply elsewhere or that the rules will converge on the EU model.
Packaging infrastructure
Even a recyclable design fails if no local system can collect, sort and process it. The bottleneck varies by packaging format and location. Safety and classification, design, collection, sorting, transport, processing, economics or end-market demand may each be the deciding factor. Advanced sorting exists in parts of Europe and North America, but capacity for some complex medical formats is still limited, and how the build-out is funded differs by market.
The collection and sorting gap. Packaging circularity depends on physical infrastructure that can collect, sort and process specific polymers at the right purity and volume. Without it, even well-designed packaging becomes linear waste, incinerated or landfilled because the local system cannot handle it. In Europe, several countries have advanced sorting infrastructure, but capacity for some multi-material medical formats is still limited.
In hospitals, some clean packaging can be separated before use, for example outer packaging opened before patient contact. Infectious, pharmaceutical-contaminated and other hazardous waste must be classified and handled under the applicable rules[42]. Separating waste at source is hard to sustain consistently in time-pressured clinical settings spread across many locations[18]. In North America, the Healthcare Plastics Recycling Council (HPRC) has run regional collection pilots for streams such as sterilisation wrap, film and rigid packaging, but these remain geographically limited and depend on hospitals taking part[47][48]. In many lower-resource settings, the immediate priority is still basic separation of infectious and non-infectious waste rather than material recovery[42].
Materials and design are evolving. The life-sciences packaging sector is exploring innovation that must deliver quality, compliance and ease of use, and now sustainability as well[211]. Primary packaging is the hardest layer to change. Replacing multilayer structures without losing barrier is complex, but success stories are emerging that aim for mono-material structures, lighter packs and recyclability, such as mono-PET and mono-PP blisters with thin cyclic-olefin or coated barriers and recyclable lids[212][213]. Design now reaches every component: labels, adhesives, lacquers and inks are chosen to suit the container’s recycling stream and to avoid substances of concern[212][157].
Three things hold adoption back:
- the higher cost of circular solutions[214]
- the lengthy qualification required for any change of material or seal[215]
- regulatory exemptions that reduce the pressure to change some healthcare packaging[33][152].
Secondary packaging is moving faster. Plastics are being downgauged or replaced by fibre-based solutions, such as moulded-fibre trays for vials, pens and pre-filled syringes[216]. In transport packaging, reuse models are available for cold-chain containers and pallets[35][37][217], although reuse remains niche across packaging overall[218].
Advanced recycling, investment and incentives. Advanced (chemical) recycling is widely seen as the most promising route to recycled plastics for sensitive healthcare applications, because it can turn plastics back into polymers that can be qualified for those uses. Scaling it up, however, is proving hard. The European Commission’s Joint Research Centre finds that pyrolysis-based polymer cannot compete without regulatory demand or a price premium[214].
Source: European Commission Joint Research Centre [214]
The rules for counting recycled content from chemical recycling are still taking shape. The EU adopted its first fuel-exempt mass balance rules in 2026. They apply only to recycled PET under the Single-Use Plastics Directive, though the Commission intends them to serve as a model for wider legislation[219]. Decarbonisation can pull in a different direction too, favouring lower-impact materials that are not necessarily more circular.
Funding is uneven. In the EU, the PPWR’s “recycled at scale” test from 2035 is expected to shape investment, but no dedicated funding instrument covers the build-out. In North America, EPR fees fund recycling-system costs. Without subsidies or financial incentives for better infrastructure, technology and sustainable materials, many circular options are likely to remain at pilot scale.
Packaging market
Market estimates show a large and growing healthcare packaging market and a smaller sustainable segment. Providers define the market differently, and revenue does not measure waste or circularity. Consumer surveys show lasting interest in sustainable packaging, while hospitals buy according to their own procurement and compliance requirements. Personalisation and home care are multiplying the number of SKUs, which makes standardisation harder.
Financial scale and growth drivers. One study expects the global medical packaging market to roughly double between 2025 and 2036[14].
About 6.7% growth a year (CAGR 2026–2036), from one provider. Market revenue, not a measure of waste or circularity. Source: [14]
Growth is expected to come from rising pharmaceutical production, biologics manufacturing and medical-device output, which sustains demand for sterile-barrier, primary and secondary packaging. The global expansion of biologics and vaccine capacity adds demand for specialised cold-chain formats, such as compatible pouches, vials and temperature-controlled transport systems. Supply-chain integrity requirements and serialisation mandates are driving the adoption of smart packaging with RFID tracking, temperature monitoring and tamper evidence.
Source: [14]
Plastic is the largest material and bags are the largest format, while pharmaceuticals and biologics form the largest end-use segment[14]. Much of this growing volume will be sold in markets with fragmented packaging rules, which adds pressure on producers’ decisions about material, design, cost and strategy (see the regulation overview above).
Consumer, patient and customer demand. When people choose or use healthcare products, packaging matters mainly through safety, efficacy, convenience and cost. Sustainability is a real but secondary consideration. Asked what decides an over-the-counter purchase, US adults most often cite a brand they know works for them, price or value for money, well ahead of pack size[177].
Source: [177]
Across consumer goods, price and quality are very or somewhat important to more than 70% of US consumers, against about a third for environmental factors. For packaging itself, product safety and shelf life rank first, and label information has gained importance with rising interest in health and wellness[178]. Patients add usability needs: packs they can open, understand and use correctly, since confusing packaging has been linked to medication errors. These needs are often traded off against cost, timelines and requirements such as child resistance[179].
Sustainability expectations are nonetheless durable. In McKinsey’s 11-country survey, 51% of respondents rated the environmental impact of packaging as extremely or very important, unchanged since 2020, and recyclability ranked as the most important trait[16]. Consumers and patients therefore expect sustainability without compromise on safety, efficacy, convenience or price. Institutional customers apply the same logic through procurement and compliance. NHS Supply Chain, for example, verifies supplier packaging data for its top-selling products to support EPR reporting, and plans to work with suppliers on reducing and redesigning packaging[160].
Cost, innovation and functionality. Rising plastic and raw-material prices have become a key pressure on packaging costs. In the second quarter of 2026, Flexible Packaging Europe recorded exceptional increases across almost all substrates, driven by Middle East tensions, energy costs and tight resin supply[220].
Source: Flexible Packaging Europe [220]
Prices may ease as supply recovers, but volatility is now part of every packaging decision. Meanwhile, innovation is bringing new barrier technologies and materials, from mono-material structures with thin barrier coatings to fibre-based alternatives[212][216]. In healthcare, though, two rules decide adoption. Functionality is non-negotiable, because a new material must protect the product as well as the one it replaces[215]. And cost remains a key driver, especially where circular options still carry a premium[214]. Suppliers that combine both, and can show a lower footprint across the pack’s life, are best placed to compete.
Medical and therapeutic trends. The growth of home healthcare, wearable diagnostics and ambulatory care is creating new packaging challenges. Packaging for home-use devices must be patient-friendly, easy to open and with clear instructions, while still meeting sterility requirements. The shift toward personalised medicine and smaller batch sizes is increasing the number of packaging SKUs, which makes standardisation and recyclability harder to achieve at the same time.
Packaging supply chain & operations
Packaging supply used to be treated as a cost line. Geopolitics has made it a question of resilience. Conflict and trade policy are disrupting access to polymers, films and foils and pushing up their cost, and tariffs are pushing life-sciences companies to regionalise manufacturing. For packaging, that means fewer single-source dependencies and more qualified alternatives in each region, each with its own validation cost. Recovering used packaging is a practical constraint too, though it is an operational challenge more than the main supply-chain trend.
Material access and cost. Geopolitics now shapes which packaging materials producers can get, and at what price. Healthcare producers feel these shocks directly, because they cannot simply switch materials:
- 01ShockThe Strait of Hormuz closes during the 2026 Middle East crisis, disrupting shipping.[220]
- 02PressurePrices for polymers, films and foils rise sharply in Europe.
- 03ConstraintSwitching materials takes time because manufacturers have to test and validate any change to a qualified pack.[215]
- 04ResultWith few immediate alternatives, manufacturers face higher packaging costs and a greater risk of supply interruptions.
Regionalisation. Life-sciences companies are responding by moving supply closer to their markets, with tariffs and government action shaping where they manufacture[221].
Source: [221]
Resilience by design. In packaging, single sourcing is increasingly seen as an unacceptable risk. Suppliers recommend qualifying two components, or even two material technologies, early in development, so that a disruption or a regulatory change does not force late revalidation[222]. As supply chains regionalise and packaging rules diverge between markets, producers may need to qualify several material and supplier options matched to the regions where they sell, each with its own validation and change-control cost. Building circular options into those qualification plans from the start avoids paying for resilience and sustainability twice.
Investment flows. Investment in sustainable healthcare packaging is growing, driven by EPR fees, ESG reporting and customer demand. Packaging companies are funding mono-material solutions, digital traceability and advanced (chemical) recycling, although these recycling processes vary in the inputs they accept, their yields and their environmental performance[158]. The EU’s Horizon Europe programme and national innovation funds are directing public money at the same problem.
Reverse logistics and recovery. Getting used packaging back is still an operational constraint. Clean packaging has to be collected from many clinical settings spread across sites, where separating it correctly depends on training. Contaminated packaging must be handled as infectious, pharmaceutical or other hazardous waste and cannot be recycled[42]. And the economics usually only work once enough volume is collected in one place.
EPR schemes in Europe are meant to fund collection, but implementation is uneven, and in North America the collection of medical plastics is still mostly at pilot scale[47][48]. Where nobody collects it locally, packaging that is recyclable by design is not recycled in practice.
Packaging technology

Switching to mono-materials is a leading near-term trend because it can make recycling simpler. A mono-material design still has to be collected and mechanically recycled, and that depends on coatings, adhesives, residues, the shape of the pack and local infrastructure. Digital product passports and supplier carbon reporting are frameworks still being developed, with specific obligations phased in over time. They are not yet universal requirements for healthcare packaging.
Material innovation: mono-materials and bio-based alternatives. Multilayer laminates, such as polyester and polyethylene combinations, give strong barriers, but their bonded layers make them hard to recycle, although not every multilayer structure is impossible to separate. That is driving a shift to mono-material structures of 100% polyethylene or 100% polypropylene, which one adhesives supplier reports as a leading commercial trend in flexible packaging[24]. Matching the barrier of multilayer packs takes real material-science innovation.
…and a local system accepts it[157].
Advanced recycling is a group of processes, among them pyrolysis, gasification and dissolution, that differ in the inputs they accept, their yields, their safety and their environmental performance. Their output counts as material-to-material recycling only when it becomes feedstock for new materials and not fuel or energy, and it is not automatically safe or equivalent to virgin material for healthcare use[158].
Bio-based materials, such as those made from sugarcane or corn starch, are gaining ground in secondary packaging. Two limits apply:
- a bio-based feedstock alone does not make a pack recyclable, biodegradable or lower in lifecycle footprint
- in primary medical packaging, their use is still limited by biocompatibility and sterility-validation requirements.
Smart packaging and digital traceability. Smart packaging, such as RFID tags, NFC chips and digital watermarks, is emerging to support automated sorting and material traceability. The EU’s Digital Product Passport (DPP) is a framework still being developed, with product-specific obligations set one product group at a time[30]. It is not yet a universal, mandatory material passport for healthcare packaging. Where DPP-type data does become available, it could help sorting facilities identify and route medical plastics.
Life Cycle Assessment (LCA) as a competitive tool. LCA tools are becoming standard for suppliers that want to measure and communicate their environmental performance. The NHS Net Zero Supplier Roadmap is being phased in: carbon-reduction-plan requirements already apply to new NHS procurements, and new requirements for product-level carbon footprinting are planned from April 2028, with scope and methodology to be agreed with suppliers and regulators[159]. That 2028 milestone is not the start of the roadmap, and it does not automatically mean independently verified full LCAs in every tender. Credible product-level data is still becoming more important in health-system procurement.
Circular packaging scaling strategies — calls for action

Governing packaging as a portfolio is the key to recovering real business value from packaging in healthcare. A single recyclable format, a claim about a lower-carbon material or a standalone pilot won’t make a significant difference on its own. Manufacturers need to prioritise the changes with the greatest potential, align product and operational decisions, gather evidence before making claims and invest with partners where recovery at scale depends on shared infrastructure.
That portfolio spans formats with very different constraints, which is exactly the complexity a producer has to manage, not resolve away in one redesign. The test that follows is not whether any single pack can be redesigned; it is whether the organisation can repeatedly convert that complexity into better product stewardship, stronger user confidence, more resilient market access and lower avoidable material burden.
Packaging levels differ in how hard they usually are to change. A level is not a legal or risk category, though, and no level guarantees a low-risk change.

Product contact & sterile barrier
E.g. blisters, vials, syringes, device pouches — function assessed item by item.
Typical constraints: sterility, stability, compatibility, change control.
Options to assess: simplification, mono-material design, bio-based or attributed feedstocks, closed-loop recovery.
Cartons, leaflets & labels
May carry mandatory safety and use information.
Typical constraints: required information, legibility, tamper evidence.
Options to assess: minimisation, recyclable mono-materials, electronic leaflets only where rules allow them alongside or instead of mandatory paper information.
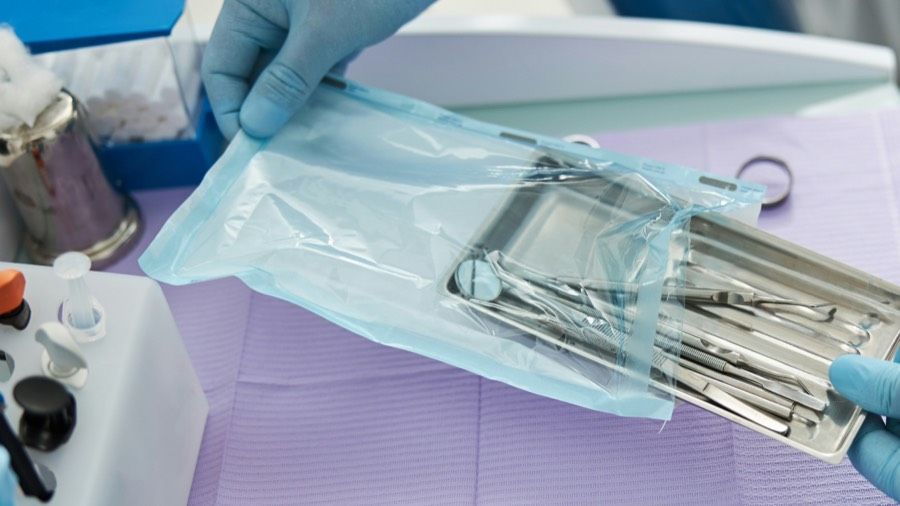
Trays, shippers & transport
A tray may be a sterile barrier or transport packaging.
Typical constraints: protection in transit, returns, cleaning.
Options to assess: reuse systems, closed-loop recycling of high-grade polymers, recovery.
Recycled content, at every level: subject to product-specific qualification and applicable rules.
Classify each component by what it actually does: its function, its relationship to the product, contact, sterile-barrier role, the information it must carry, its intended users, its market and its change pathway. A device pouch can protect a sterile device without contacting a drug. Labels and leaflets can carry essential safety information. Trays can be sterile barriers or transport packaging. And the function of a vial, syringe or IV bag must be assessed individually.
Packaging circularity should therefore follow a risk-based, portfolio-led sequence. Start with the opportunities that are feasible now, often but not always in secondary and tertiary formats, and develop the more demanding formats in parallel, through the validation required to protect sterility, integrity and patient safety. That needs a clear view of products, markets, regulatory pathways, manufacturing constraints and the end-of-life systems they enter, so that investment goes first to the most achievable, defensible and valuable opportunities.
Healthcare packaging circularity is a stakeholder system. The producer or brand owner is accountable for the package placed on the market, but delivering circularity depends on a system of internal decision-makers, direct suppliers and operating partners, market and user stakeholders, and end-of-life actors, all working inside an external regulatory frame.
The lost value in packaging comes from systemic causes, not a single point of failure: siloed decisions across stakeholders, weak incentive for producers to move first, regulation that is fragmented and slow to scale across geographies on top of non-negotiable GxP requirements, and broken material, information and financial flows between the actors who would otherwise close the loop together. That’s why Governance comes first among the four themes below, ahead of Design and Data. The way decisions are made has to change before responsibility for circularity can extend beyond the technical teams and budget owners who have led the work so far. Each call to action is marked Internal if it depends mainly on the producer’s own organisation, or External if it depends mainly on partners.
Everything from here down is organised under four themes: Governance decides who owns a choice and what backs it, Design turns that choice into the product itself, Data keeps the evidence live and shareable across every hand-off, and Ecosystem carries all of it beyond the producer's own four walls.
Governance
Own the decision: distribute accountability across functions, build the frameworks that make trade-offs repeatable, and ring-fence the budget that backs them.
Design
Translate governance into the product: eliminate before substituting, then design around essential function and a proven recovery route.
Data
The Data theme activates Governance to become a live, interoperable system, portable across every hand-off, not just accurate at the moment it was compiled.
Ecosystem
Scale all of it beyond the producer's own four walls: upstream partners, return-loop infrastructure, regional recovery and adoption at the point of use.
Governance is the organisational substrate the other three themes run on. The people who own and carry decisions, the process that lets those decisions get made without escalating every trade-off, and the budget that makes either one real.
People: ownership, capability and decision traceability Internal
The people side of governance comes down to three things, and each can fail on its own: who owns a decision, whether they are equipped to make it well, and whether the decision leaves a trace someone can stand behind later. They belong together. Ownership without capability produces confident bad decisions. Capability without traceability produces good decisions that no one can later prove were made responsibly.
| Area | What to do |
|---|---|
| Governance organisation | Name one accountable owner for each priority format. Rather than housing accountability in one central team, give them cross-functional input from the functions that make packaging decisions (quality, regulatory, procurement, commercial and R&D), each with a defined decision right and an escalation path back to shared targets. Give quality and regulatory functions clear release or stop rights. Involve clinicians, infection prevention, environmental services, suppliers and users where relevant. A cross-functional portfolio forum with an executive sponsor sets direction and resolves conflict. It should not be a queue every decision has to pass through. |
| Capability and literacy building | Build a tiered curriculum in LCA literacy and circularity for the roles that make or approve packaging decisions. A routine trade-off can then be read and defended at the point of decision, instead of being escalated to a small central sustainability team to translate. Judge competence by evidence that people can make and document the relevant decisions, not by training attendance or certification alone. |
| Decision-making traceability and evidence record-keeping | Create one minimum evidence record for each priority format, covering material composition, supplier information, quality status, EPR classification and the claim the evidence supports. Use it for claims, reporting, tenders and investment. Trace each record back to the decision that produced it: which gate it cleared, who approved it and what funding line supported it. |
Accountable owners
- One accountable owner per priority format
- Executive sponsor and cross-functional governance council (quality, regulatory, procurement, commercial, R&D)
- Clinical and infection-prevention input where relevant
- Sustainability/L&D
- Product-stewardship or data lead
- Finance
How to start
- Set a governance charter naming one accountable owner per priority format, decision rights, quality and regulatory release-or-stop rights, and escalation paths per format family
- Build a tiered LCA/circularity curriculum for decision-making roles
- Define the minimum evidence record for priority SKUs and link it to the decision and funding line that produced it
KPIs to measure
- Priority formats with one named accountable owner
- Share of sampled decisions documented to the agreed standard by the people who made them
- Formats with a complete, traceable evidence record
- Time to escalate and resolve cross-functional conflict
The test of this cluster: for every priority format, can the organisation name who owns the decision, whether that person is equipped to make it, and whether the decision leaves a record someone else could audit.
Process: decision frameworks and enablement that scale Internal
A governance forum that reviews every packaging decision does not scale, and a capable team still needs the right tool at the right moment: one to make the decision well, one to carry it to a customer or tender afterward. Both are process, not people—frameworks that operate without someone having to reinvent them each time.
| Area | What to do |
|---|---|
| Eco-design and innovation/sustainability gateways | Build formal eco-design criteria into the existing stage-gate process for packaging and product development. Score options against environmental, social and technical criteria. At each gate, compare the options and check safety, function, the relevant legal review and any validation required at that stage. Make it a formal requirement to consider whether packaging can be eliminated before looking for a substitute. Mono-material design is a preference to test, not an unconditional pass/fail rule, and an early research project need not yet have an operating recovery route; a verified recovery route is required before claiming actual recovery or launching a programme that depends on it. |
| Commercial and internal enablement | Give sales and tender teams commercial toolkits with the sustainability claims and comparison data they need in customer conversations. Pair them with an internal communication cadence and financial/ROI foresight tools that make circularity investment read as commercial logic, not overhead. |
Accountable owners
- Packaging/product design, sustainability, regulatory affairs, quality
- Commercial/sales enablement, marketing and internal communications, finance
How to start
- Define eco-design gate criteria against the existing stage-gate process and pilot it on the next redesign already in the pipeline
- Build one commercial toolkit for the highest tender-relevance product line and one internal communication cadence tied to completed redesigns
KPIs to measure
- Share of new designs scored at gate
- Redesigns cleared without escalation to the governance forum
- Toolkit use in live tenders
- Tender-win rate where sustainability was scored
- ROI cases documented
Budget: ring-fenced resource and investment allocation Internal
None of the above moves without capital behind it. A governance charter, a gateway and a literacy programme establish the process. What turns that process into action is a clear route to funding both Capex and Opex. Ring-fence that funding so it survives tighter budgets, when general sustainability spending is often among the first things to be cut.
- Base each allocation on a comparable business case covering qualification, tooling, materials, transport, labour, cleaning, site space, EPR, data, waste handling and product-loss risks.
- Specify who pays and who benefits.
- Test the assumptions.
- Set explicit continue, revise or stop decisions at each milestone.
- Release funding against those milestones rather than as a single upfront grant, so the funding decision and the portfolio-governance decision in G1 run on the same evidence.
Accountable owners
Finance, executive sponsor, portfolio/packaging leadership.
How to start
- Set aside a protected Capex and Opex budget for the packaging formats your governance process has already marked as top priority.
- Back each one with a business case that can be compared like for like.
- At each milestone, decide whether to continue, change course or stop.
KPIs to measure
- Share of approved initiatives with a comparable business case and ring-fenced funding
- Milestone decisions taken (continue/revise/stop)
- Cost, emissions and losses per safely delivered unit or successful shipment against baseline
- Funding retained through a budget-cycle review
Design translates Governance's frameworks into the product itself, and runs on three moves: subtract before you specify, weigh the full-lifecycle trade-off against real data before locking a design, and build against where the bar is going, not only where it stands today.
Simplification: run an elimination review before a substitution review Internal
The first design question should not be which lower-impact material can replace this component. It should be whether the component is still needed at all, and if it is, whether its function can be delivered more simply elsewhere in the system. This is the highest-order circular intervention on the heatmap because, done well, it can reduce material, sourcing complexity, storage volume, transport demand and disposal burden at the same time, rather than trading one material impact for another — though removing a component does not automatically save cost, carbon or regulatory effort.
Before removing a component, identify what it does. It may provide tamper evidence, protect the product, keep out dust, keep information visible, support dosing or help ensure safe handling. That function must be preserved. Check whether another component can take it on, whether it can be combined with another function or whether the packaging needs to be redesigned. Then compare the whole system — including distribution damage, information, usability and product loss — not the removed component alone.
In the Alliance to Zero case below, the blister on a pre-filled syringe was removed entirely rather than swapped for recycled plastic. Its protective and security functions moved to a redesigned label and cap. Because it removes material rather than substitutes it, elimination can improve material efficiency and, where the remaining architecture is compatible with the applicable PPWR design-for-recycling requirements, strengthen recyclability performance[33]. It does not by itself determine a packaging grade, or remove the need for format- and market-specific assessment and change control.
Accountable owners
Packaging or product design, regulatory affairs, quality, procurement.
How to start
- Run an elimination review on the top 5 formats by volume or EPR risk.
- Name each component's function.
- Decide jointly whether to remove, consolidate or transfer it.
KPIs to measure
- Components eliminated per unit
- Redesigned shipment or pallet density
- Storage volume
- Complaint rates
- Distribution damage
- Product loss
The benefits can add up. Removing a component can lower sourcing costs and EPR fees, reduce emissions from materials, distribution and storage, and simplify the packaging portfolio. Use a whole-system comparison to verify those gains and check whether the change creates problems elsewhere, such as more transit damage or product loss. Every change still needs to go through formal change control.

Alliance to Zero: secure blister-free syringe packaging
A cross-industry working group — Körber (packaging), Schreiner MediPharm (functional label) and SCHOTT Pharma (COC syringe), convened by the Alliance to Zero — developed a collaborative concept that removes the plastic blister from pre-filled syringe packs, rather than swapping it for recycled plastic[25][26]. A tamper-evident first-opening label and a redesigned cap take over the blister's protective and security functions, and syringes ship in a paperboard carton. The concept passed an ISTA 3A shipping pre-test with no reported breakage or leakage and the tamper-evident seal intact[25]. Removing the blister does not make the whole pack plastic-free, or show that it is recycled in practice.
These are the project team's own scenario estimates on the Alliance to Zero concept page, not results from a commercial deployment or hospital use. A 25% higher pallet density is not the same as 25% smaller pack dimensions. They are kept separate from SCHOTT Pharma's own case study on this concept, which reports a different metric set on a different measurement basis.
Performance: design around essential function, trusted use and proven recovery Internal
Material choice follows function. Every format should start with a clear statement of what it must do, and only then move to material or format decisions. Depending on the product, a pack may need to:
- preserve barrier performance
- protect product integrity
- maintain sterility
- support correct and safe use by whoever handles it, whether a clinician, a home-care patient or a caregiver
- carry information
- survive distribution
- enable efficient storage
- reach a verified end-of-life route
Once that baseline is clear, a producer can see which layers, additives, components and material families are essential, and simplify the design wherever validated performance allows. Mono-material structures, lower-carbon feedstocks, recycled content and bio-based alternatives can all lead to a simpler design, but none of them is automatically circular. Before calling a design circular, test it against four conditions:
| Condition | What it takes |
|---|---|
| Performance in use | Passing the applicable integrity, barrier, stability, sterilisation, distribution and usability tests |
| Safety and quality | Evidence that the design is safe and meets quality requirements |
| Local recovery | A recovery route that actually exists where the pack is used |
| A credible claim | A claim about the design that the evidence can back up |
When a mono-material design passes those four tests, it is often the most commercially mature option. Some multi-layer laminates are hard to recycle because their layers are bonded. Mono-material structures can work with mechanical recycling, but only if coatings, adhesives, labels, residues and the shape of the pack allow it[157]. One adhesives supplier reports mono-material flexible packaging as a leading commercial trend[24]. Assess recovery as five separate steps:
- 1Design compatibility
- 2Local collection
- 3Recycler acceptance
- 4Actual reprocessing
- 5End use
Set priorities by each portfolio’s architecture, exposure and opportunity, and not by volume alone. Secondary and tertiary formats will often move first. Their functional and regulatory pathways tend to be easier to manage, and moving them reduces exposure to the multi-supplier, multi-material laminate chains that are hardest to secure and audit. High-volume primary blisters and pouches may justify parallel investment, but only once the barrier, sterility, stability, manufacturing and market-specific change-control pathway is clear and a credible recovery route exists. Not every primary blister or pouch faces the same 2030 PPWR requirement. Immediate medicinal packaging and contact-sensitive device packaging, for example, are excluded from the design-for-recycling requirement[33][152].
The rule for sequencing throughout this chapter: move first where value, feasibility and control meet, rather than where tonnage is highest.
None of this is a judgment call made on instinct. Weigh each candidate architecture’s trade-off against real data, not against which option sounds most defensible in the room:
| Evidence | What it is for |
|---|---|
| Live exposure and EPR-cost record of packaging(described in the Data theme next) | For where material, regulatory and cost pressure is actually concentrated |
| LCA data | For the environmental trade-off between competing material options, rather than a single-metric substitution |
| Governance’s Process cluster (G2) eco-design gate criteria | As the bar a candidate has to clear before it moves forward, rather than a discretionary check a designer raises inconsistently |
This card sets the test a design has to pass; it draws the evidence from elsewhere in the framework rather than building a parallel scoring system.
Accountable owners
Packaging or product design, quality, regulatory affairs, product experience, supplier management.
How to start
- Write a function-to-material brief per format: intended user and population, critical functions, material architecture, validation and recovery route.
- Score each candidate against DA1's exposure data, available LCA data and Governance's G2 gate criteria before the design is locked.
KPIs to measure
- Pack complaint rates
- Usability success by population
- Integrity failures
- For recovery, share of formats with evidence at each step


Olympus × DuPont: Tyvek® with renewable attribution
The Olympus and DuPont sterile-packaging case illustrates why precision matters when a producer claims progress. Olympus has announced that, from 2026, it will introduce DuPont™ Tyvek® with Renewable Attribution into sterile packaging for more than 100 single-use device categories, starting at its Japan and Vietnam facilities before wider roll-out[27] — an announced, early-stage rollout. The material uses an ISCC PLUS-certified mass-balance approach, in which renewable feedstock is attributed to the product rather than physically traced into it. DuPont states that the material keeps Tyvek®'s material specifications and manufacturing process[161], and the partners' modelled comparison estimates a roughly one-third lower carbon footprint for the material[27][161].
Future proof: build against where the bar is going, not only where it stands Internal
A design that clears today's bar can still be outdated before it reaches volume. Rather than assuming a single, settled 2030/2035 bar, track by market and format the known requirements, the exceptions that apply, the rules still pending, the portfolio’s exposure and the evidence gaps. In the EU:
| Rule | Where it stands |
|---|---|
| Recyclability grades | Grades A–C (at least 70%) from 2030, subject to the delegated acts; from 2038 only A and B (at least 80%)[33]. A format designed to just reach 70% meets the 2030 bar and drops out in 2038, one redesign cycle later. |
| Design-for-recycling criteria and the “recycled at scale” test | These depend on implementing rules that are still being adopted. |
| Healthcare exceptions | They are subject to scheduled Commission reviews that may confirm, amend or narrow them. These are reviews, not automatic expiries[33][152]. |
| The PPWR’s PFAS restriction | It covers PFAS above specified limits in food-contact packaging[33]. It is not a general healthcare-packaging ban, though it signals the direction of chemicals-of-concern policy. |
Practical readiness means knowing, for each priority format, which requirements apply and what evidence would be needed if they changed, rather than re-opening the design file under deadline pressure.
The same forward posture applies to how a design gets validated, not only to what it's made of.
- What it is
- Virtual replicas of individual vials built from high-speed camera and pressure-sensor data during capping. They let a producer monitor container-closure integrity in real time against a validated baseline instead of relying solely on end-of-line destructive sampling, and are being positioned against EU GMP Annex 1 expectations[28].
- Where it stands
- Early-stage and provider-claimed, not yet independently audited on reject rate or cost.
- How to use it
- Treat it as a potential support tool that must itself be validated for the actual product and process. Run predictive and simulation-based methods in parallel with, not instead of, the evidence regulators require, so the physical testing plan a future design needs is better targeted.
Material and supply exposure moves on its own timeline too. The Data theme next illustrates where a design team should watch it rather than rediscovering it at the next sourcing crisis. Bio-based feedstocks are a longer-horizon position, not a near-term substitution plan:
Source: [29]
So a design that assumes fast bio-based scale-up is building on a supply base that isn’t there yet.
Chemicals-of-concern regulation is on the same trajectory as PFAS: today’s permitted substance is a plausible future restriction.
A design that treats the current regulatory list as the ceiling, rather than a floor likely to tighten, is the one that ends up re-engineered under deadline pressure.
Consumer and reputational expectations are moving on a parallel, non-regulatory track.
Source: [16]
That is a consumer signal a producer can design toward, while institutional purchasing follows its own procurement requirements.
Deliberately out of scope here: two future-back pressures that matter as much as the ones above — an ageing population's changing needs at the point of use, and shifting climatic zones' effect on material and distribution performance — are real, but this report doesn't yet carry evidence for them at the same standard as the dated, sourced items above. They belong in a closing synthesis across all three deep-dives (Packaging, Single-Use Devices, MedTech), not a single-vertical design card built ahead of that evidence. Depending on the situation and portfolio of the producer, they may still apply.
Accountable owners
Packaging or product design, regulatory affairs, sustainability/product stewardship, procurement.
How to start
- For one priority format, map the known requirements, applicable exceptions, pending rules, exposure and evidence gaps in each market where it is sold
- Name its bio-based or restricted-substance exposure using DA1's data
- Scope where a validated digital twin or simulation method could support, not replace, physical validation
KPIs to measure
- Priority formats with a current requirements-and-exceptions map per market
- Evidence gaps closed
- Time from design freeze to validation-ready
- Substances of concern tracked per format
- Designs re-opened due to a foreseeable regulatory shift
Readiness is a practical discipline: track what is published, what is pending and what evidence is missing, and instrument the design process to catch changes early.
Build a live, interoperable evidence and exposure backbone across every hand-off External
Governance’s G1 cluster already asks for a minimum evidence record; that’s necessary but incomplete on its own, in two directions at once. First, outward: packaging information must become usable by everyone it passes through:
- 1Converterqualifies it
- 2Logistics operatorhandles it
- 3Healthcare siteseparates it
- 4Recycleraccepts it
- 5Customerevaluates it
- 6Regulator or schemescrutinises the claim
That requires interoperability, a shared minimum information model, defined data owners, a secure method of exchanging records and clear rules for what may be disclosed. Existing identifiers such as UDI and the developing Digital Product Passport framework[30] are potential building blocks, preferable to a parallel proprietary system, but neither is yet an established, universal interoperability system for packaging composition and recovery data. Start with a shared, versioned record for one priority format, piloted with a supplier, a healthcare site and a recycler, so it stays portable across hand-offs instead of stuck inside one company’s own tools.
Second, the most compelling packaging opportunity is not automatically the highest-volume format, or the one facing the nearest regulatory deadline. It is the format where material intensity, market exposure, EPR cost, supply concentration, redesign feasibility, operational benefit and recovery potential intersect, and that intersection shifts as prices, supply and regulation move. Turn the priority-format record into a live exposure heatmap rather than a periodic manual scoring exercise. For example:
| Format | What the heatmap may show |
|---|---|
| A transport tray with known return points | May justify immediate investment in a closed loop |
| A secondary carton | May already be ready for right-sizing |
| A sterile-barrier redesign | Needs a multi-year validation pathway |
The sequence should update as the evidence does, not only at the next scheduled review.
AI can support this as decision support. Models trained on packaging-material cost drivers may flag price or supply risks earlier[31], and waste-intelligence platforms can model how a candidate pack design may perform in sorting facilities before it is produced[32][162]. Both must be validated against the relevant facilities and materials; a prediction, a modelled recyclability score or an identifier alone is not proof of physical recovery or legal compliance.
The same need for evidence applies to packaging claims. Claims must be accurate, clear about what they cover and backed by evidence. This applies under both the PPWR’s provisions on environmental claims and general consumer protection law[33]. A record that teams keep up to date makes it easier to organise and retrieve that evidence than an ad hoc spreadsheet.
For each priority format, the record should capture:
- component identity
- material composition and weight
- the evidence source and date
- quality and change-control status
- applicable market classification
- local recovery conditions
- actual outcomes
- the precise claim the evidence supports, distinguishing physical recycled content from mass-balance attribution
Define who owns each data element, who may access it and who refreshes it. The producer should make the record portable at key hand-offs without exposing competitively sensitive terms or technical intellectual property.
Producer accountable owner
Product stewardship/data lead, quality/regulatory, IT/digital, finance, commercial and procurement.
Essential external partners
- Material/converter suppliers, logistics providers, customers/providers, recyclers, digital scheme operators
- Industry standards bodies where relevant
How to start
- Pilot a shared, versioned record for one priority format with one supplier, one healthcare site and one recycler, and test whether each can use it without clarification.
- In parallel, score the priority-format portfolio on material weight, EPR class and spend, supply concentration and redesign feasibility, and validate any automated or AI-supported refresh against actual facility and material data.
KPIs to measure
- Data completeness and refresh latency at hand-off
- Verification rate
- EPR cost and virgin-material exposure tracked live
- Number of manual data requests
- Tender-response time
- Recycler acceptance against agreed test results
- Share of records with a dated evidence source and defined owner
- Substantiated-claim rate
Kenvue × Greyparrot: scoring a pack before it's made
Kenvue and Greyparrot have announced a strategic collaboration in which Greyparrot's Deepnest platform uses observations from operational recycling facilities in the UK and US to show how Kenvue's consumer-health packaging, and components such as pumps or labels, are detected and recovered, and to model design changes and their EPR cost impact before prototypes are made[162][32].

EMVO / EMVS: governed, cross-border packaging-data infrastructure
The European Medicines Verification Organisation was established in 2015 by manufacturers (Medicines for Europe, EFPIA, Affordable Medicines Europe), wholesalers (GIRP) and community pharmacists (PGEU) to operate the European Hub required under the Falsified Medicines Directive[34]. Manufacturers upload product identifier and master data to the European Hub, which acts as a gateway to the National Medicines Verification Systems that form the national layer of the medicines-verification architecture; the stakeholder groups have jointly agreed technical and quality standards for the system[34].
- A single EU-wide Hub, governed jointly by the industry associations that depend on it, not owned by one company or run solely by a regulator.
- Shared technical and data-quality standards across the European Hub and the national systems.
It takes a whole chain of people to make circular packaging work at scale. The producer or brand owner remains accountable for the packaging specification, the commercial decision and the claims they make. What happens to the pack depends on the people who develop the materials, move and manage the packaging, use it in healthcare settings, recycle it and buy the recovered material. Together with industry and public bodies, they can work out what capabilities and infrastructure are missing, and where to build them.
Co-industrialise upstream, and co-invest in the networks that run at scale External
There are two ways producers can back their partners before a solution is proven. The first is to build upstream, working with partners to develop the packaging format before the specification is locked. The second is to help fund and use a shared network that will handle the packaging once it starts shipping. In both cases, producers commit money and give partners a reason to count on future demand.
Upstream co-industrialisation
Align with material innovators, converters, fillers/CMOs and component suppliers before the final specification is locked. Agree on:
- the function to be protected
- the evidence required
- manufacturing constraints
- the demand threshold that would justify capacity investment
The producer keeps the product decision and commercial choice. Partners jointly resolve the system risks that would otherwise stop a design at prototype stage: material availability, line compatibility and scale-up timing.
Bio-based feedstocks stay a longer-horizon position, not a near-term substitution plan. They were roughly 1% of Europe’s total plastics production in 2024[29], and are best pursued through precompetitive coalitions such as CiPPPA rather than each producer rebuilding the relationship alone.
Networked operating models
Choose the operating model for controlled B2B reusable formats lane by lane. For thermal containers, transport shippers, totes and trays, compare producer-owned, pooled and managed-service arrangements. Pooled and managed services can aggregate flows across customers and lanes. A producer-owned loop may suit a dense, stable lane.
Compare the options on:
- return rates
- losses
- cleaning
- repair
- quality responsibilities
- cost and emissions per successful shipment
Specify tracking or condition and location sensing according to the product and route risk, and write it into the contract where it is needed, rather than treating it as an automatic requirement for every case.
The same rule applies to both. The producer sets the direction and retains the risk. The partner brings capability, capacity or reach beyond what the producer can provide.
Producer accountable owner
Packaging development, procurement/category management, quality/regulatory, manufacturing, supply chain and logistics.
Essential external partners
- Material supplier, converter, filler/CMO, component supplier, materials-innovation labs and academic/public R&D consortia
- 3PLs, freight forwarders, distributors, managed-asset provider, cleaning/conditioning partner
How to start
- For two priority formats, create a joint industrialisation brief.
- Separately, select one high-density lane and compare producer-owned, pooled and managed-service return options on return rate, losses, cleaning, repair, quality responsibilities, and cost and emissions per successful shipment, with tracking specified according to product and route risk.
KPIs to measure
- Formats moving from concept to commercial qualification
- Time to scale decision
- Supply-source resilience
- Return rate
- Asset loss
- Quality deviations
- Cost and emissions per successful shipment

SkyCell: a controlled loop for temperature-sensitive shipments
SkyCell's hybrid active/passive containers replace single-use passive shippers on temperature-controlled pharma air-freight lanes, using IoT monitoring to track condition, location and utilisation across each reuse cycle rather than treating the container as consumed after one trip, a live example of the return-loop conditions this call sets out. Using an emissions-estimation tool developed by MIT's Center for Transportation & Logistics[35], SkyCell's own sustainability team modelled its reusable 1500X container against a single-use passive container on two lanes. On Atlanta–Mexico City, the modelled saving was 56% with no reverse logistics and 18% with the empty container returned by air; on Melbourne–Tokyo it was 46% with an ocean return and 2% with an air return[163]. These are modelled scenarios, not measured fleet averages. A separate, earlier life cycle assessment by myclimate, with a different baseline, found SkyCell containers roughly halve per-shipment CO₂ against conventional competitor products[36].

Peli BioThermal: Rental+ managed reusable thermal packaging
Rental+ is a commercially operating, multi-region reusable-container service. Peli BioThermal, not the shipper, owns the bulk reusable-container fleet (Crēdo Vault™, Crēdo Cargo™ and Crēdo Xtreme™) and offers conditioning, assembly, ship-out, inspection, refurbishment, repair, and release-and-return logistics management, with service locations listed across North America, South America, Europe, the Middle East and Asia-Pacific[37]. For a pharma shipper, that is reuse capability it does not have to build alone. The public page does not, however, describe cross-region redeployment or pooled-utilisation rates for these containers.
Start where the geography is ready, then scale in partnership External
Recovery infrastructure and point-of-use adoption are one question, not two: can the regional system handle a format safely and economically, and will the people expected to open, separate or return it actually do so — so both get scoped to a place before either gets scaled.
Regional recovery system
Align precompetitively with peers on the shared conditions:
- format scope
- safety classification
- collection and signage standards
- contamination thresholds
- data and measurement
Then co-invest in a defined stream and geography only once these are in place:
- recycler acceptance
- site protocols
- costs
- a verified end market
- infection-prevention approval
- a clear definition of eligible material
- worker-safety measures
- staff time and training
- contamination controls
- a safe, lawful fallback disposal route
Start with the recycler’s quality and safety requirements, not a collection campaign. Keep this evidence visibly separate from Governance’s decision-traceability record: it has to travel across organisations and prove a system outcome, not a producer’s own claim.
Mechanical and advanced recycling stay two separate co-investment tracks in the same regional system, not one recycler-acceptance conversation.
Three examples show different stages and outcomes:
- The VinylPlus PharmPack project reports pilot-scale production of pharma-grade blisters containing 30% PVC recovered by dissolution-based recycling[38][167] (material incorporated into new product, at pilot scale).
- A US university health system diverted 13,792 lb of mixed non-hazardous healthcare plastics, including Tyvek®-type packaging, from landfill in nine months through an advanced-recycling partnership with DuPont and Freepoint Eco-Systems[39] (a diversion figure: the public case study does not say what the output became).
- Daiichi Sankyo Healthcare has collected about 20 tonnes of PTP blister sheets for a gasification demonstration with JFE Engineering that converts them into synthesis gas, a possible feedstock for plastics or fuels[40] (collection and processing at demonstration stage).
Point-of-use adoption, in that same geography
Instructions, waste containers, signage, training and collection frequency have to be route-specific to what actually exists locally. Co-design them with the actors who open, use, separate or return the format:
- clinicians
- cleaning and environmental-services staff
- pharmacy teams
- distributors
- where relevant, patients or caregivers
A package should never point to a recovery pathway that does not exist where it is sold.
Use the pack itself as a local interface where the format and rules allow. Labelling and reusable-packaging information requirements under the PPWR depend on the format, timing and exceptions[33][152], and digital watermark detection has been demonstrated in industrial sorting of household packaging[41][166].
Pair this with an incentive suited to that market:
- A share of EPR savings or fees passed to sites, which must be established under the relevant scheme and contract (it is not automatic).
- Scan-verified transparency on what a return became.
- A repurposed local scheme, such as the Containers for Change refund revenue that funds Queensland Children’s Hospital’s blister-pack recycling, which collected about 24 kg (roughly 16,000 packs) for recycling with Pharmacycle in its first three months[43].
Industry bodies and public partnerships get engaged only for the genuinely shared, non-competitive barriers: common sorting rules, training materials, recycler specifications. Neither substitutes for producer investment or package-level accountability.
A design earns a regional circularity claim only once collection, recovery and the person actually handling it all clear the same local test — and patient or caregiver participation is used only where it is safe, necessary and supported by a real local pathway.
Producer accountable owner
- Sustainability/product stewardship, public affairs, procurement and supply chain
- Commercial/customer teams
Essential external partners
- Provider environmental-services teams, collectors, recycler/reprocessor, local public authority, end-market buyer
- Distributors, pharmacies, patients/caregivers where relevant, industry bodies
How to start
- Identify one non-hazardous stream and geography
- Before collection, agree the eligible-material definition, recycler acceptance specification, infection-prevention approval, site protocol, safe fallback disposal, cost allocation and end market, and establish a baseline. In that same geography, map the responsible handler for each priority flow and co-test instruction, signage and training at the point of use
KPIs to measure
- Eligible material generated
- Collected
- Rejected
- Accepted
- Actually reprocessed
- Put to a verified end use
- Instruction comprehension
- Participation
Measure in consistent units and periods against a baseline, report recycling separately from energy recovery, and pair the figures with safety incidents, service impact, cost, usability, staff time and site workload.

PVC Recycling in Hospitals: Australia and New Zealand
The Vinyl Council of Australia's PVC Recycling in Hospitals programme began as a pilot at Western Health in Victoria in 2009[44] and was launched as a broader programme in 2013[164]. It is the closest operating example in this report to the call above: a defined regional collection, training, logistics, reprocessing and end-market model. It targets three standardised streams of clinical consumables — IV bags, oxygen tubing and face masks, which are clinical products, not packaging, in this example — across more than 280 hospitals and healthcare facilities in Australia and New Zealand, using centrally produced training materials so site adoption does not depend on each hospital building its own protocol, and channels collected material to two named reprocessors, Welvic in Australia and MattaProducts in New Zealand[44]. The programme reported about 119 tonnes collected in 2021 and more than 545 tonnes recycled since 2015[164]. The Vinyl Council also estimates that at least 2,500 tonnes of locally recyclable material is available for collection — potential supply, not measured programme throughput[44].



SCHOTT Pharma × Corplex × Takeda
SCHOTT Pharma, Corplex and Takeda tested closed-loop recycling of single-use polypropylene trays that hold vials in transport. In the pilot reported in 2024, around 20 tonnes of used trays were returned through 13 controlled collections and reprocessed into granulate, from which new trays were made; laboratory testing over multiple recycling cycles found the closed-loop trays met the requirements of their application[45]. The source does not report how much of the 20 tonnes became finished trays. The scheme has since moved to initial operational use: SCHOTT reports a first full-batch delivery of vials in trays containing recycled polypropylene to Takeda's site in Singen, Germany, in August 2026, after formal change control, with broader expansion to other European customers planned[165].
Mölnlycke × Sabic × Coveris × ACE × Artivion
In partner-reported pilots, segregated, non-contaminated operating-room plastic waste from Zuyderland hospital was converted by pyrolysis into oil, which SABIC used to make certified-circular polyethylene (TRUCIRCLE). Mölnlycke then produced surgical drapes, delivered in its ProcedurePak solution, with 49% attributed content under certified (ISCC PLUS) mass balance; converter ACE supplied the drape film. In a separate branch, converter Coveris produced packaging for an Artivion product with 25% attributed recycled content[46].

HPRC: a model for shared recovery infrastructure
HPRC (United States). The Healthcare Plastics Recycling Council has supported two of the clearest precompetitive pilots to date[47][48]. In Chicago, hospitals of Advocate Health Care and NorthShore University HealthSystem worked with haulers, material recovery facilities and processors to test collection and sorting of non-infectious sterilisation wrap, film and rigid plastics from clinical areas. Mechanical, energy-conversion (pyrolysis to liquid hydrocarbon) and chemical routes were explored at small scale and route by route; energy conversion is not material recycling, and several arrangements were not commercially sustainable at the time[168]. A separate 2023 pilot paired B. Braun Medical with Lehigh Valley Health Network and advanced recycler PureCycle Technologies: about 18,000 lb of mixed non-hazardous medical plastics were collected over eight months, and bags with a high share of blue sterilisation wrap were much cleaner than mixed bags. The main barriers were collection and transport costs, hospital space and staff training[169].
HolyGrail 2.0: SKU-level detection, tested at materials-recovery-facility scale
Led by AIM (European Brands Association) and powered by the Alliance to End Plastic Waste, a 100-day industrial trial (August–December 2024) at the Hündgen Entsorgung materials-recovery facility in Germany sorted post-consumer rigid household packaging collected in Germany and Denmark. It recorded 5.66 million Digimarc digital-watermark detections across 5,949 unique SKUs — about 56,000 a day — with reported detection efficiency of 87.9%–93.8% across the measured categories in single-pass sorting[166][41]. The organisers state the results show readiness for commercial deployment and a potential route to support PPWR compliance.
Scale evidence: use operating models, not false packaging analogies.
There is no public, at-scale pharmaceutical-packaging circularity case that cleanly demonstrates the full chain in one place.
That chain runs from patient communication and pharmacy participation to packaging recovery and closed-loop material use. What the most advanced and scaled initiatives cited above do demonstrate is the building blocks that make that chain possible: higher rates of information and data flow, and non-competitive platforms built by people who understand the nuances of healthcare's and life sciences' regulated operating framework.
Single-use devices (SUD)

Single-use devices (SUD) are central to modern healthcare. They support infection control, procedural consistency and treatment in settings beyond the hospital, including outpatient care and self-administration at home. After their use, these products create a growing and complex end-of-life waste stream. In the Regulation section below, you'll find the different angles of how different geographies define the boundaries of a SUD: typically a single-use device is intended for one use, or for use on one patient during a single procedure.[49][50] This covers a broad range of products and materials. Some are relatively simple polymer items. Others combine several plastics with metal, glass, drug reservoirs, batteries, sensors or electronic components. They may be used in vascular access, surgery, diagnostics, drug delivery or patient monitoring. Their function, material composition and care setting all affect what can happen after use.
circularity opportunities
Explore development, production, use, on-site collection and sorting, and recovery pathways. Hover or click an opportunity to see its recommended action.
 DevelopmentDevice design
 ProductionManufacturing
 UseHospital / pharmacy
 Collection & sortingAt point of use
 ReprocessingWhere permitted
 RecyclingMaterial recovery
 IncinerationResidual waste
01 Implement circular design choices early on and involve the value chain
03 Actively support collection systems and compliance
02 Build scalable infrastructure regionally to close the loop – with a partnership mindset
05 Pioneer and lead collective, open systems – one bin, shared ownership
04 Bring the data backbone to reality (UDI, DPPs) with practical use cases
SUDs deserve their own vertical because they are neither packaging nor durable MedTech. Packaging protects a medicine or device and carries required information; it can be complex and safety-critical, but it does not perform a clinical function. MedTech equipment is designed to remain in service, with maintenance, repair, refurbishment or resale as possible parts of its lifecycle. A SUD performs a clinical function and may come into contact with a patient, a sterile field or body fluids. It is typically placed on the market for a single use, with no plan to return it to service or give it a second life. This creates a different combination of safety, regulatory, operational and commercial constraints.
SUDs represent a complex product ecosystem and clinical reality, and hence there is no single circular strategy for SUDs. In very simple terms, this waste stream currently faces three options:
- incineration or landfill (depending on region), the predominant business-as-usual reality
- increasingly, a take-back and recycling system
- increasingly, reprocessing for reuse
The central question is which route is safe, permitted and practical for each device family in specific regions. The single-use designation is the starting point for the device's intended use, but does not determine the circular route that may follow.
| Route | Aim | What it requires |
|---|---|---|
| Recycling | Recovering material after the device has left service | Safe segregation, treatment, separation and a viable material recovery |
| Reprocessing | Returning a suitable device to clinical use | Validated cleaning, sterilisation and functional performance, as well as compliance with the applicable regulatory framework |
The sections that follow explore the actions needed to reduce avoidable use, enable validated reprocessing where appropriate, and recover material where a safe and credible route exists. Redesign is the most upstream route. For example, a device can be split into a durable, reusable body and a single-use or refillable consumable. That design choice can keep part of the device out of the waste stream before any end-of-life decisions are needed. The appropriate pathway depends on the device design, its clinical use, contamination risk, material composition, local regulation and available infrastructure.

Vascular access & fluid delivery
Syringes, catheters, cannulas, IV/infusion tubing — highest volume by weight of any SUD family.
Procedural & surgical instruments
Laparoscopic instruments, trocars, biopsy forceps, EP/cardiovascular catheters — complex geometries, the primary reprocessing target.

Diagnostic disposables
Sample tubes, test kits, blood collection devices — lower unit value, high unit count.

Combination-product delivery devices
Prefilled syringes, auto-injectors, inhalers — dual drug/device regulatory identity.
| Challenge | What it means |
|---|---|
| Liability inversion | Once a device leaves the OEM's control, safety liability can shift to whoever reprocesses it, a hand-off that doesn't exist in packaging recycling or MedTech refurbishment. |
| Design against reuse | Devices are engineered for maximum safety, performance and efficiency in a single use, which in many cases limits their potential for a second life. |
| The clinical-contact ceiling | Most SUDs interface directly with sterile sites or patient fluids, so a circular pathway has to clear an infection-control bar that packaging recycling and most MedTech servicing never face. |
| Regulatory geography | Liability and legality of reprocessing fragment sharply by jurisdiction, more so than Packaging (harmonising under PPWR) or MedTech (harmonising under MDR/WEEE) — detailed next in §3.2.1 (A). |
What boundaries are we defining for SUD in this discussion paper, and why?
In the scope of this paper:
- Single-use polymer and combination-product devices with direct patient or fluid contact — syringes, catheters, tubing, IV sets, single-use surgical/endoscopic instruments, cardiovascular devices, diagnostics and single-use combination-product components.
Out of scope for this paper:
- PPE and textiles (gowns, masks, drapes, wipes) — their nonwoven, multilayer construction sits on a materially different recycling pathway from rigid/flexible device plastics, compounded by decontamination requirements and regulated-medical-waste disposal economics[51][52].
- Absorbent hygiene products (incontinence and other absorbent products) — not packaging, not a device and not capital equipment, so none of the three verticals covers them, although they are one of the largest waste streams in care settings.
The in-scope streams are the most tractable part of the problem, not the largest.
Global SUD trends and developments
SUD regulation & legislation
What can be recycled or reprocessed depends largely on a patchwork of fragmented local waste and reprocessing laws. The rules for SUDs are becoming clearer in the US and EU. In APAC, packaging and EPR rules largely shape the approach. In parts of LATAM and MEA, outright prohibitions are common.
The premarket baseline. The premarket bar for SUDs varies sharply with risk class. In the US, most new devices reach the market through the FDA's 510(k) pathway — roughly 3,500–4,000 submissions a year, against only 30–50 original Premarket Approval (PMA) applications. A 510(k) requires the manufacturer to demonstrate "substantial equivalence" to an already-cleared predicate device, typically within a 3–5 month review. Only the highest-risk Class III devices need a PMA, which must independently prove safety and effectiveness, usually with clinical trial data, over a 12–24 month timeline[58]. The EU applies a comparable class-based logic under the MDR: Class I devices can self-declare conformity, but Class IIa, IIb and III devices — which include most procedural and combination SUDs — need a Notified Body certificate before they can carry the CE mark. Only around 45 Notified Bodies are currently designated under the MDR, and their 6–18 month assessment queues shape how quickly new single-use devices, and new reprocessing pathways, can reach the market[59]. The result is a fast, precedent-based track for most new SUDs and a much slower, capacity-constrained track for anything higher-risk.
The waste-law baseline. A device's regulatory identity under FDA or MDR governs how it reaches the patient; it says almost nothing about what may be done with it afterwards. The moment a single-use device is discarded it passes into a different legal regime entirely — waste law — and three questions decide whether recycling is even permissible: how the material is classified, who counts as the waste producer, and which treatment methods are approved. In practice the hospital is the waste producer and carries the legal duty, which is why pre-acceptance and the waste declaration sit with the institution rather than with the manufacturer or the service provider. That allocation is the structural fact from which everything else in this section follows.
The regulatory core question is: when does a device stop being waste?
For recycling the decisive question is status. It is typically key that SUDs intended for recycling or reprocessing are sorted at source to avoid becoming waste. Waste regulation typically only allows waste to cease to be waste once it has undergone a recovery operation and meets defined criteria. Where those criteria cannot be satisfied for used medical components, the material remains legally waste and cannot be reclassified as a product, which forecloses reuse of the material outright in some jurisdictions[18]. For infectious and contaminated waste, even stricter rules on waste handling apply. Every operational question — who may hold the material, where it may travel, what it may become — resolves back to this one. Answers vary by region and determine the structure of the whole market.
Fragmented by design. The US has no federal medical waste framework and is mainly focused on state programmes. Every state has enacted its own rules, and they differ in ways that matter operationally: how regulated medical waste is defined, which categories fall inside it, how long material may be stored before treatment, which treatment technologies are approved, and what documentation must follow the load.
Read more on North America
Recycling and waste law
Treated material can in principle be recycled once rendered non-infectious, but the threshold at which that happens is set state by state. A national recycling programme is therefore not one regulatory problem but fifty.
Reprocessing
For reprocessing, the US FDA has the most developed regulatory framework for SUD globally. Under 21 CFR Part 820 and the FDA's Quality Management System Regulation (QMSR, in force since 2 February 2026)[120], reprocessors must demonstrate that reprocessed devices meet the same safety and performance standards as the original[60] — 510(k) clearance or PMA approval, cleaning validation, sterilization validation and functional performance testing. Demanding, but clear, and it has created a trusted market for validated reprocessed devices; Canada follows a similar approach under Health Canada's guidance.
An emerging coherent framework. The EU has the most developed waste architecture, and healthcare sits awkwardly inside it. Medical devices fall within the scope of the WEEE Directive and its producer-responsibility obligations — registration, reporting, and financing collection, treatment and recovery.
Read more on EMEA
Recycling and waste law
But devices expected to be infective before end of life are expressly excluded from WEEE, and that exclusion removes much of the single-use clinical category from the one instrument that would otherwise place recovery duties on the manufacturer. The result is that SUD recycling in Europe proceeds largely without a producer-responsibility backbone, on national waste rules and voluntary programmes.
Beyond that, as sterile barrier systems and secondary packaging account for a substantial share of clinical single-use material, this reaches the healthcare stream through packaging rather than through device law. As described above, the Packaging and Packaging Waste Regulation (EU 2025/40) applies from August 2026 and introduces graded recyclability: from 2030, or later depending on when the delegated acts are adopted, only packaging rated A, B or C (70% or more recyclable by weight) may be placed on the EU market, and from 2038 only grades A and B (80% or more).
Another fact to consider is that recovered device material is waste in transit, and the Basel Convention governs its movement across borders. Plastic waste escapes hazardous-waste controls only if it is destined for environmentally sound recycling, is almost free of contamination, and consists essentially of a single non-halogenated polymer — or of PE, PP or PET mixtures destined for separate recycling.
Reprocessing
For reprocessing, the Medical Device Regulation (MDR, EU 2017/745) and the IVDR (EU 2017/746) govern the pathway. The MDR permits reprocessing of SUDs under specific conditions, but the pathway is complex and varies by member state — ambiguity in "end-of-waste" status prevents used medical components being legally reclassified as products in some jurisdictions, blocking reuse or remanufacturing outright[18]. A proposed MDR revision (December 2025) is currently under development. Around ten EU and EEA countries, among them Germany, the Netherlands, Belgium, Spain and Sweden, already permitted SUD reprocessing under national rules notified under Article 17 of the MDR[224]. Denmark joined them on 1 January 2025 with a national route under Article 17(2). From the same date, the Netherlands added reprocessing under common specifications (CS, Article 17(3)) to its existing CE route[225].
Producer responsibility arriving ahead of healthcare-specific rules. The region is building its recycling obligations through general EPR regimes rather than through medical-device legislation. Japan and Korea operate well-established EPR schemes, Singapore and other ASEAN states are rolling out packaging EPR, and India is strengthening its framework with digital registration, traceability obligations and recycling targets.
Read more on APAC
Recycling and waste law
For manufacturers this means obligations attach through the packaging and electrical-equipment routes, with healthcare treated as one sector among many rather than as a special case — coherent in principle, but leaving the clinical-waste classification question to national rules that differ widely.
Reprocessing
The regulatory landscape for reprocessing is also evolving, with a few relevant examples to note: Japan's PMDA framework treats remanufactured SUDs as separately approved medical devices, requiring marketing authorisation, quality and manufacturing controls, serial-number traceability, and roughly annual PMDA inspections. Australia's TGA updated its UDI framework in 2026 to state that reprocessing a SUD creates a new medical device requiring ARTG inclusion and a new UDI-DI — rigorous frameworks that create high compliance costs, favouring large certified reprocessors over smaller operators. China's NMPA revised its Good Manufacturing Practice for Medical Devices in November 2025, tightening quality standards across the device lifecycle[62], while India's CDSCO framework places legal liability for in-house SUD reprocessing on the healthcare institution itself, making it the de facto "manufacturer" under ISO 13485.
Classification as prohibition. Here regulation does not merely fail to enable recycling; in places it forbids it. Healthcare plastics are frequently classified as risk waste by default on the basis of potential contact with blood or body fluids, which routes them to incineration or autoclaving regardless of recoverability — in South Africa this is the principal reason healthcare plastics are not diverted at all.
Read more on LATAM and MEA
Recycling and waste law
In parts of Mexico, local regulation mandates incineration for defined categories of medical waste outright. No end-of-waste pathway exists to be argued, because the material never leaves the risk-waste stream. The result inverts the usual sequence: infrastructure and economics are downstream questions that cannot be reached until classification moves first.
Reprocessing
Formal third-party SUD reprocessing regulation is also largely absent. In-house reprocessing happens in hospitals across both regions, but without the validation protocols, quality management systems or regulatory oversight of mature markets — not merely a sustainability concern but a patient-safety risk, since unvalidated reprocessing of complex devices (multi-lumen catheters, for instance) can leave residual contamination or compromise device integrity. The result is a paradox: the regions that most need the cost savings of reprocessing are also the least equipped to do it safely.
SUD infrastructure

Both the supply of new SUDs and the infrastructure to close the loop are highly concentrated and capital-intensive, but capacity is uneven. North America and Europe lead on recycling and reprocessing (though only a fraction of recoverable material is captured), while APAC is fast-growing as producer-responsibility regimes and local facilities emerge.
A concentrated supply side, buying through a concentrated demand side. The infrastructure that puts new SUDs into hospitals in the first place is highly consolidated on both ends. A handful of global OEMs — Medtronic (~USD 33.5B revenue), J&J MedTech (~USD 31.9B), Medline (~USD 25.5B), Stryker, BD and a small set of comparable-scale peers — manufacture and distribute most of the world's disposable devices, running dedicated single-use production lines[63][64]. On the buying side, hospital procurement is just as concentrated: five group purchasing organizations control roughly 90% of US hospital purchasing agreements, and about 97% of hospitals belong to at least one GPO, pooling volume to negotiate 10–15% supply-chain savings directly with these OEMs[65]. That two-sided concentration — a small set of manufacturers selling through a small set of purchasing intermediaries — is the infrastructure the reprocessing industry has to plug into, which is exactly why GPO contract terms surface later in this section as a competitive lever in their own right.
Both recycling and reprocessing require critical infrastructure. SUD recycling depends on a chain of capabilities that has to exist end-to-end before a single device can be recovered:
- 1Containersin the clinical setting
- 2Reverse logisticsfrom the hospital to the processor
- 3Decontaminationstandalone or by the processor
- 4Separationinto clean material streams
Separation is increasingly supported by AI-based detection for sorting. The share of hazardous or contaminated waste can be significant, requiring dedicated collection and treatment processes. Every recovered stream also needs an offtake market and partners willing to take it.
Finding the treatment and material recovery partners can demand a complex search process. The availability of recycling capacity and partners depends heavily on the technical product characteristics (material mix, value, and so on), but also on the volumes and the geographical context. The capital intensity sits with the recycling processor rather than the hospital. Infrastructure focused on mechanical recycling is the prevailing norm, where the value of the recovered material depends heavily on the quality of the feedstock and on scale. Advanced chemical recycling technology is under development. SUD reprocessing also requires industrial-scale infrastructure. It relies on the same collection networks reaching thousands of clinical settings, and on advanced decontamination facilities. On top of that, it needs cleanrooms, sterilization capacity (EtO, autoclave or hydrogen peroxide plasma), functional testing equipment and quality management systems. This infrastructure is capital-intensive and depends on highly skilled operators.
The end-of-life material exists at scale, and almost none of it is recovered through recycling. Industry estimates put clean, non-infectious healthcare plastics in the US at roughly one million tons a year[121], of which around 5% is recycled today[1].
Read more on North America
Recycling
The constraint is not the absence of end markets — advanced recyclers will take this material and pay for it — but the reverse logistics and sorting capacity needed to deliver it in a usable form. That is where investment is now going: waste processors are increasingly prepared to commit capital to dedicated sorting and recycling capability for healthcare streams as collected volumes rise and become predictable.
Reprocessing
The infrastructure for reprocessing is also growing — companies including Stryker Sustainability Solutions, Cardinal Health Sustainable Technologies and STERIS operate large, FDA-registered facilities serving thousands of hospitals. The Association of Medical Device Reprocessors (AMDR) reports that nearly 10,000 hospitals, surgical centres and US military surgical hospitals benefited from reprocessed SUDs in 2024[66].
Recycling capability most firmly established. Recycling capability for single-use devices is most firmly established in Europe. The UK, the Netherlands, the Nordics, Germany, Spain and France all have facilities able to take SUD material through decontamination, separation and out into recovered streams.
Read more on EMEA
Recycling
Operators add recycling capacity where volumes justify the investment. They plan and build new plants based on commitments to supply enough feedstock. That same need for volume makes small, fragmented streams the hardest to place. Recycling facilities are designed for high throughput, and the output from a single hospital or one device line in one market often falls below the minimum a plant will accept.
The demand pressure runs the other way, and it originates with the hospitals: they carry their own obligations to reduce carbon and to account for the materials they consume, and they pass those requirements down to their service providers and through them to the device manufacturers. Across EMEA that has become sustained pressure on manufacturers to bring a recycling route to market alongside the product itself.
Reprocessing
For reprocessing in Europe, Germany's Vanguard AG is the leading third-party reprocessor, operating under a well-established national framework; the market is consolidating as smaller operators struggle with the MDR's compliance burden. The UK's NHS is a major demand driver, with its Net Zero Supplier Roadmap creating procurement incentives for reprocessed devices.
The emerging infrastructure. Recycling is the fastest-growing segment of medical waste management in the region, forecast at roughly 20% annual growth through 2033 as hospitals and laboratories stand up collection programmes for plastics, glass and packaging[67].
Read more on APAC
Recycling
Much of the enabling structure is arriving through general extended-producer-responsibility regimes rather than through healthcare-specific rules: Japan and Korea operate well-established EPR schemes, Singapore and other ASEAN states are rolling out packaging EPR, and India is strengthening its framework with digital registration, traceability obligations and recycling targets[68].
Reprocessing
APAC is also a fast-growing region for SUD reprocessing. Cardinal Health's new remanufacturing facility in Beresfield, Newcastle (Australia), opening in 2026, is the first dedicated SUD remanufacturing facility for the ANZ market[66] — built locally on the explicit recognition that shipping waste across oceans for reprocessing defeats the carbon-reduction purpose of circularity in the first place. In Japan, Stryker and Sakura Healthcare Support have formed a collaboration to advance SUD remanufacturing under PMDA oversight.
The infrastructure gap. The recycling infrastructure gap is rooted in the waste-classification rules described above, which frequently categorise SUD end-of-life as risk waste by default on the basis of potential contact with blood or body fluids.
Read more on LATAM and MEA
Recycling
In South Africa this classification is the principal reason healthcare plastics are not diverted to recycling at all. In parts of Mexico, local regulation mandates incineration for defined categories of medical waste outright, foreclosing recycling as a legal matter before economics enters the question. The underlying waste systems compound the problem: across MENA less than 10% of waste of any kind is recycled and more than two-thirds is mismanaged.
Policy is moving — Chile has introduced EPR obligations and Colombia a national circular-economy strategy targeting single-use plastics — but the sequence matters. Until a jurisdiction permits decontaminated device material to leave the risk-waste stream, neither collection infrastructure nor processing capacity changes the outcome.
Reprocessing
Certified third-party SUD reprocessing infrastructure is also virtually non-existent: a compliant reprocessing facility requires significant upfront capital investment that is hard to justify where reimbursement frameworks do not explicitly support reprocessed devices. The MEA SUD reprocessing market was estimated at USD 0.67 billion in 2025 and is expected to reach USD 1.41 billion by 2030[69], but that growth is driven largely by in-house hospital reprocessing rather than formal third-party services.
SUD market
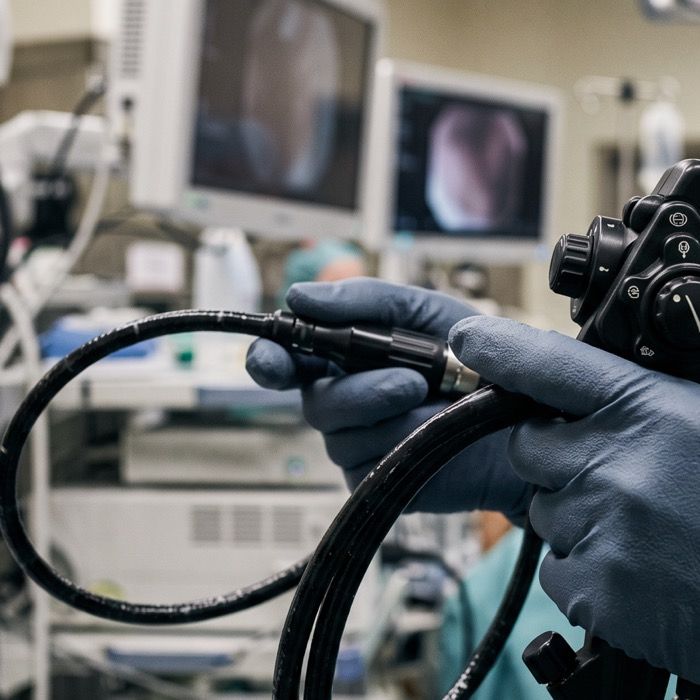
The single-use device market is growing as demand rises for GLP-1 and aesthetic self-injectables and more electronic, app-connected disposables enter the market. Those electronics also make end-of-life handling more complex. Alongside recovering plastics, recyclers face some of the same challenges as they do with e-waste.
Demand-side accelerants: aesthetics and new therapy classes. Some demand-side shifts are pulling new volume into SUD from outside its traditional clinical base. New drug classes, particularly GLP-1 agonists, are shifting injections from occasional clinic visits to regular self-administration at home. As more patients start these treatments, the number of single-use devices they use and discard grows. The GLP-1 autoinjector/pen market is projected at a 15.6% CAGR through 2035 as indications expand from diabetes into weight management and cardiovascular, kidney and liver disease[70], inside a broader longevity and wellness pharmaceutical market[71]. The aesthetic-injectable segment is itself a fast-growing category[72][73].
The self-administration device is getting more sophisticated. The same convenience pressure pulling patients toward home and self-administered therapy is adding electronics content to the device itself: wearable and app-connected injectors, smart pens and continuous monitors are folding electronics into what used to be a simple polymer disposable. The wearable injector market is shifting toward smart connectivity, real-time dose monitoring and miniaturised, discreet on-body form factors[74], and GLP-1 pen segmentation now includes Bluetooth-enabled, NFC-enabled and app-integrated variants alongside the traditional disposable pen[70]. What is already clear is that SUD end-of-life is starting to inherit e-waste-style handling requirements for a growing slice of the category — a complexity that didn't used to exist in this vertical at all.
The tension between OEMs and third-party reprocessors. The broader single-use/disposable medical device market is projected to grow at a 5.78% CAGR until 2035, spanning everything from syringes and catheters to diagnostic disposables, surgical instruments and gloves[57]. So both the need for proper recycling capacity as well as reprocessing is growing. The most significant market dynamic is the challenging relationship between OEMs and third-party reprocessors.
| Pushing back on reprocessing | Pushing for it |
|---|---|
|
|
Reuse-by-design is not a one-way trend, and continuous glucose monitors show the pull running the other way. Where some reusable insulin pens split a durable, reusable body from a single-use consumable, the newest generation of continuous glucose monitors is moving in the opposite direction. Earlier systems paired a disposable sensor with a separate, reusable transmitter worn across many sensor cycles; current-generation sensors now build the transmitter electronics directly into the disposable sensor patch, so the whole assembly — battery, chip and all — is discarded every 7–14 days instead of only the sensor[76]. The design logic is genuinely patient-facing — fewer parts to apply, nothing separate to lose — but it is also a concrete instance of the electronics-creep this section has already flagged.
Which direction a device family moves in comes down to a specific design decision made by its manufacturer, not an inherent property of the product category.
SUD supply chain & operations
Medical device supply chains still largely follow a linear path from manufacture and distribution to use and incineration. Recycling and reprocessing loops are emerging as alternatives. Both depend on clinical staff following collection procedures and on strong quality management to control contamination, degradation and regulatory risk. These loops are increasingly seen as a way to make supply chains more resilient amid geopolitical disruption and concentrated global manufacturing.
The default supply chain is linear. Devices move from manufacturing sites in the US, Europe or Asia through regional distribution hubs to hospitals and clinics. Intermediaries such as professional distributors handle compliance and UDI verification. For drug-coated or biologic-paired devices, they also actively manage the cold chain to keep products within a validated temperature range from factory to point of use[64].
After use, these devices add to a growing waste stream. That waste currently has three possible routes.
Today, that chain mostly ends in thermal treatment. In European hospitals waste is segregated at the point of generation into streams defined by the European Waste Catalogue and signalled by container colour and waste code. Infectious clinical waste, for example, falls under code 18 01 03* (hazardous).
Read more on thermal treatment
The WHO puts genuinely hazardous healthcare waste at about 15% of the total, the remaining 85% being comparable to household waste[42], but misclassification routinely inflates the hazardous share — at the significant cost that hazardous medical waste carries.
- 1Baggingat ward and theatre level
- 2Interim storagekept secure on site
- 3Collectionby a licensed carrier
- 4Treatmentincineration or an alternative
- 5Disposalof the residue
Consignment documentation travels with the load. Treatment is high-temperature incineration at 850–1100 °C with gas cleaning, or autoclaving, steam or microwave treatment where the stream permits. The decision that determines the outcome is made at the bin.
A single-use device is committed to that path by its classification, not by its composition. Once it enters the infectious stream it is destined for thermal treatment regardless of the steel, aluminium or engineering polymer it contains, and, under current collection practice, nothing downstream retrieves it: the container is sealed and treated without being opened for sorting. Emerging post-container sorting could change this (§3.2.1 (E)), so this is a constraint of today’s practice rather than of principle. Today, the fork between a linear and a circular outcome is therefore not a processing decision taken later by a waste contractor.
It is taken in seconds, at the point of use, by a clinician choosing a container — which is why every circular chain that follows begins there.
Take-back and recycling systems are professionalising, turning linear systems into circular ones step by step. Used devices are collected in theatre, decontaminated, then shredded and separated into material streams that go back into a secondary cycle.
Read more on take-back and recycling
- Collection starts in theatre. The sequence at the point of use is fixed, and it begins with the clinical team. The device is wipe-disinfected and freed of gross residue, then placed into a dedicated container held in the operating room rather than going into the general clinical waste stream. Those containers are purpose-built for the take-back system: the lid is specified according to the waste classification of the stream it serves, so a container is either accessible for further additions or closed once filled. Two exclusions sit with the clinical team, because under current practice no later step can correct them — batteries are removed from any device that contains them, and potentially infectious devices never enter the system at all.
- The containers travel to decontamination. Once filled and closed, they move to decontamination before any material processing begins. There are two routes. In the first, a dedicated decontamination provider is appointed and the devices are sterilized there, by autoclaving, ultrasonic bath or ozone treatment depending on the device and its materials as well as the locally available infrastructure. In the second, the waste processor holds that capability on its own site and the containers travel directly to the yard, where decontamination happens before the material moves into processing. Which route applies shapes the rest of the chain: it sets how many custody handovers the material passes through, how far it travels before it is safe to handle, and who issues the decontamination certificate the downstream steps rely on.
- Recycling breaks the device back into materials. After decontamination the devices enter the recycling process proper. They are shredded and separated into their constituent parts, and the output is sorted into discrete material streams. What leaves the process is no longer an instrument with a function but a set of graded materials, each with its own onward route and its own market.
- The recovered material streams go back into the secondary cycle. In practice, this means recycling or downcycling. Recycling means that high-quality recycled material may be sold on the open market (open loop), or actually be used by the same manufacturers to make new products (closed loop). That closes the loop in a commercial sense as well as a physical one: the material that left the hospital returns to the company that put the device into the market in the first place. But this is often not possible for technical reasons. Hence downcycling may apply to lower-quality recycled materials, which may be used in other applications (e.g. plastics for furniture).
- Sort before you shred. Downcycling is partly a consequence of the process itself. When shredding comes first, polymers are mixed before they can be identified, and a mixed fraction cannot be qualified as a defined grade. Separating devices into clean fractions before size reduction keeps higher-value routes open: recycling today, and reuse or closed-loop return as regulatory acceptance grows. MedTech already sells harvested parts as product rather than scrap (§3.3.2, call 05); the same logic applies to the material recovered from single-use devices.
- Yield depends heavily on several conditions. It depends on what the device is made of and the technical design choices with respect to recyclability. Material recovery yields also depend on the sorting quality at source and the cleanliness of the stream. In addition, the recycler’s technical capabilities and volumes make a difference. Well-organised programmes can achieve recycling rates between 75% and 95%. The significance of that range only becomes clear against the alternative: these devices would otherwise be incinerated, with the whole of their material content lost at the point where it is easiest to recover.
SUD reprocessing runs on a similar closed-loop supply chain. Hospitals segregate specific devices into dedicated collection bins, which are transported to the reprocessor, cleaned, tested, sterilized, repackaged and sold back into the supply chain. Every step needs coordination, training and quality assurance, and the primary vulnerability is "collection compliance" — if clinical staff discard SUDs into the regular waste stream rather than the designated bins, the supply chain fails at the source.
Read more on reprocessing
Consistent compliance takes ongoing staff training, clear signage and visible leadership commitment; it is a behavioural and operational challenge as much as a logistical one. Operational risks also need to be managed well: the primary risks are contamination (inadequate cleaning of complex device geometries), material degradation (some materials degrade under repeated sterilization cycles, particularly EtO), and regulatory non-compliance (failure to maintain the documentation and validation records required by the FDA, MDR or PMDA). All are manageable with a robust quality management system, but require real investment in process validation and ongoing monitoring.
Supply chain resilience as a strategic driver. The COVID-19 pandemic and the geopolitical disruptions that followed exposed how vulnerable global, just-in-time supply chains are for single-use medical products. Recycling and secondary material recovery can help secure access to critical minerals. For hospitals, a well-established reprocessing programme can provide a domestic source of critical devices, reducing reliance on international logistics and helping maintain operations during shortages. That makes reprocessing more relevant to procurement decisions, especially given trade tensions between the US and China and the concentration of device manufacturing in a handful of countries.
SUD technology
More SUDs now contain sensors, batteries and electronics that enable connectivity, making their waste streams more complex. Recycling technologies are advancing too. AI-assisted optical sorting, near-infrared (NIR) sorting and tracer-based methods are improving mechanical recycling. Chemical recycling is emerging as an option for mixed streams that are harder to process, and automated post-container sorting is being prototyped. Better data is also making it easier to trace materials through the supply chain.
The device itself is changing. As the Market section shows, miniaturisation is making it easier to build electronics into single-use devices, from wearable injectors and Bluetooth-enabled pens to app-connected diagnostics. Sensors, batteries and connectivity are becoming standard features across a growing range of SUDs[75]. This is technology innovation in its own right, driving impact for medical outcomes. At the same time, waste streams are often getting more complex.
Recycling is an innovation space. Mechanical recycling is established, and chemical recycling is an emerging technology:
| Mechanical recycling | Chemical recycling | |
|---|---|---|
| How it works | Physical processing (sorting, shredding, washing and remelting) turns plastic waste into new products, leaving the polymer’s chemical structure essentially intact | Breaks the polymer down to its molecular building blocks through processes such as pyrolysis, gasification or depolymerization, yielding monomers, oils or gases |
| Strengths | Simple and energy-efficient | The output can serve as feedstock for new plastics or other products |
| Limits | Sensitive to contamination and to polymer degradation over repeated cycles | Performs best on clean, homogeneous streams |
| Best fit for SUDs | Dedicated streams, a single polymer type and free of contamination, are likely to supply both open-loop and closed loop recycling programmes | For difficult inputs such as clinical waste, where plastic types are mixed and potentially hazardous properties are present, it is best suited to sterilize-and-sort approaches |
Much of the recent progress in mechanical recycling lies in process innovation and sorting intelligence. AI-driven optical sorting, near-infrared (NIR) spectroscopy and robotic pickers now separate polymers by type and colour with far greater precision. Emerging approaches such as digital watermarks and tracer-based sorting promise to push purity even higher, unlocking food-grade and higher-value recyclate.
Post-container sorting is at prototype stage. Today the bin decides a device’s fate (§3.2.1 (D)). An emerging approach moves that decision to the disposal site. Clinical-waste containers of several formats are opened automatically, their contents are decontaminated, and the material is then sorted without manual handling, using robotics, machine vision and machine learning trained on the recurring construction of drug-delivery devices. Nothing changes on the ward: no additional bin, and no new habit for staff or patients. The capital question moves from thousands of clinical sites to a handful of disposal sites. If it works at scale, the infectious stream stops being a permanent boundary for recovery and becomes a decontamination step. A prototype is being developed by be circular with two universities[228]; it has not yet been deployed.
Technology for reprocessing demands dedicated innovation. The technological core of SUD reprocessing is cleaning and sterilizing complex devices to the same standard as new products.
| Method | Status | Limitation |
|---|---|---|
| Ethylene oxide (EtO) | Traditional and effective but limited | A carcinogen facing increasing regulatory pressure |
| Autoclave (high-pressure steam) | Traditional and effective but limited | Does not suit heat-sensitive materials or electronics |
| Hydrogen peroxide plasma | Gaining traction as a safer alternative for heat-sensitive devices[77] | – |
Further innovations are emerging for the complex geometries of modern surgical instruments:
- AI-powered optical inspection can detect residual contamination or material degradation that manual inspection would miss.
- Software-powered cleaning systems, which have already attracted FDA attention, could standardise and document the cleaning process in ways manual methods cannot[78].
- Robotics is beginning to enter the sterile processing department (SPD), according to early research and industry investment: robotic systems can assemble surgical instrument trays more consistently than manual methods, cutting the variability that leads to delays in operating theatres.
- Suppliers including Solventum (spun off from 3M in 2024) and Getinge are expanding their sterilisation and instrument-management portfolios into integrated systems combining equipment, software and service contracts.
Digital traceability, UDI and digital product passports (DPP). The Unique Device Identifier (UDI) system is now mandatory in the US and EU, and increasingly across APAC. This enables tracking of individual devices through their entire lifecycle, from manufacture through use and reprocessing, creating the data infrastructure that validated circular supply chains depend on.
Circular SUD scaling strategies — calls for action
Single-use devices dominate clinical waste, and the variety of devices makes it difficult to scale any one circular strategy. The waste hierarchy gives a starting point. Avoid unnecessary use first and consider material recovery last. How that applies depends on the device, how it is used in practice and how regulation is evolving in each market.
The calls to action below focus on what makes these strategies possible at scale. Producers and brand owners need to make circular design decisions early, build the data they need to guide and track those decisions, and develop infrastructure that can support closed-loop systems as they grow.
From heatmap to action. For the largest group of devices, reducing use and running take-back and recycling programmes are feasible ways to build Loyalty and support compliance. Where certified reprocessing has been validated, it can generate Revenue and improve Resilience for the organisation that holds the customer relationship.
The business case for reprocessing is strongest when procedure volumes and device costs are both high. Today, the highest-value segments are cardiovascular devices such as EP catheters, guidewires and angioplasty balloons, along with laparoscopic instruments and orthopaedic devices. Reprocessed devices typically cost 25–40% less than their OEM equivalents. Those savings are well documented and give hospital value analysis committees a clear basis for comparing the two options.
Implement circular design choices early on and involve the value chain Internal
The choices producers make at the design stage shape a device’s impact throughout its lifecycle. First, ask whether the clinical application requires a single-use designation. Choose materials that meet technical performance and health and safety requirements. Where recycling or reprocessing is viable, design for that route from the start. Building these choices into the circularity programme from the outset — rather than retrofitting them later — is the key. Developing a circular design guide can be a powerful approach, especially if these design decisions already integrate strategic choices of end-of-life circular strategies. Revisiting technical specifications, providing guidance on cost/performance trade-offs, and involving stakeholders across the value chain both upstream and downstream is often key.
Design for separation as well, not just a recyclability number. Recovery yield is decided at the design stage — but not only by material mix. Also by how easy it is to collect or sort them, or how cleanly parts come apart. Designing for the collection and sorting process is itself a key lever, because it changes the outcome before the device ever reaches a hospital.
Where the product allows it, redesign for reuse is the most upstream lever of all. Splitting a device into a durable, reusable body and a single-use or refillable consumable removes volume from the waste stream before any reprocessing or recycling question is reached. Boehringer Ingelheim’s reusable Respimat inhaler, in the case below, is a working example.
Accountable owners
R&D and product teams.
Essential external partners
- External design partners and agencies
- Material suppliers
- Start-ups
- Key hospital-partner stakeholders
How to start
Developing a circular design guide — for, and ideally with, value-chain partners — that bakes end-of-life strategy into the design brief.
KPIs to measure
- Share of products meeting the design ambitions
- Share designed for separation or reuse
Boehringer Ingelheim — reusable Respimat® inhaler
The reusable Respimat splits the product into a durable device body and a replaceable medication cartridge: patients use the same device for up to six cartridges before it is replaced, rather than discarding a full inhaler every time. Boehringer Ingelheim's own lifecycle assessment, published in Advances in Therapy, measured the product carbon footprint of the reusable device against repeated single-use Respimat inhalers and found reductions of 57% over three cartridges and 71% over six[79]. The device won the 2020 Pharmapack Eco-Design Award and launched across European markets, including Ireland and the UK, from late 2019, aligned with the NHS Long Term Plan's push to cut single-use plastics in respiratory care[80].
Build scalable infrastructure regionally to close the loop – with a partnership mindset External
Check the end-of-waste criteria in each market before setting up a programme. Whether recovered material can legally stop being classified as waste determines who can hold it, where it can go and what it can be used for. In some markets, the material must remain classified as waste. Even a well-designed programme with enough collection and processing capacity has to work within that limit.
Where regulation is settled, build dedicated programmes, infrastructure and hospital trust. That means:
- collection systems
- decontamination capacity
- dedicated logistics streams
- recycling infrastructure
- certified reprocessing capability
How settled the rules are varies by jurisdiction. The US FDA’s framework under 21 CFR Part 820 and the QMSR (effective February 2026[120]) is the most demanding globally, but it is clear[60]. Germany, the Netherlands and several other EU member states already permit SUD reprocessing under national rules, and Denmark joined them in January 2025[224]. Most of the rest of the EU remains open on the MDR’s “end-of-waste” ambiguity, and LATAM and MEA have no formal third-party framework at all[18].
For example, OEMs including Johnson & Johnson MedTech have already launched their own reprocessing and take-back programmes rather than wait for third parties to capture the market. These systems are being developed in close partnerships with the respective hospitals.
Pool volume before you approach a processor. Plants are engineered for throughput. A single hospital's output, or one device line in one market, will often not clear the minimum a facility will accept at all. Device-by-device economics won’t be viable in most cases, but aggregation across sites, markets and product lines can make the difference between a pilot and a programme.
Accountable owners
Operations and supply chain with commercial, and regulatory affairs for the end-of-waste question per market.
Essential external partners
- Reverse-logistics and decontamination providers
- Certified reprocessors and recyclers
- Hospitals and health systems
- Regional regulators — and, where scale demands it, competitors
How to start
- Decide on the end-of-life strategy in key markets, where regulation is shaping clarity.
- Pool volume across sites and product lines before approaching a processor.
KPIs to measure
- Share of end-of-life products entered into controlled recycling / reprocessing
- Collection compliance score
- Regions covered by an individual or collective take-back system
NHS England — reclaiming reusable cartridge insulin pens
A durable pen body loaded with a replaceable insulin cartridge has long been the standard format; the single-use pre-filled pen is the newer, less circular alternative that has taken prescribing share on cost and convenience grounds. NHS North East & Yorkshire found 79% of insulin pen prescriptions across its region were for single-use disposable pens in 2022, and ran a prescribing-incentive scheme that shifted 16.2% of that volume back to reusable cartridge pens, at an estimated saving of roughly 4.83 kgCO2e per patient per year for each patient moved[81]. Beyond that, a recent study found that reusable insulin pens reduce plastic waste by 89% and carbon footprint by 40% compared with disposable insulin pens[82].
Actively support collection systems and compliance External
Take-back and recycling, as well as closed-loop reprocessing, all depend on hospitals segregating specific devices into dedicated bins at the point of use. If clinical staff default to the regular waste stream, the supply chain fails before it starts, regardless of how much circular capacity exists downstream. This is a behavioural and training challenge before it is a technology one: dedicated bins, clear signage, and visible institutional leadership commitment. Capacity investment ahead of a fix to point-of-use compliance is supply built into a bottleneck that hasn't been cleared.
Put two hard exclusions into the clinical workflow, not the training deck. Batteries out, potentially infectious devices never in (details depending on market and waste classification). Under current collection practice, no downstream step can correct either, and a sealed container is not opened for inspection. These belong in the procedure at the point of use, because collection is where the chain either holds or fails.
The pioneering examples show that building scalable infrastructure requires a partnership mindset. Producers need partnerships within their value chain. It may require entrepreneurial partners that help to manage the process complexity or the digital data ecosystem. Producers may also build partnerships with third-party providers, if they aim to license device designs and diagnostic data to certified third-party reprocessors on commercial terms. Scalability may even require working with competitors.
Accountable owners
Commercial and account teams, with clinical / medical affairs for the point-of-use protocols.
Essential external partners
- Hospital procurement, ward and theatre staff and sustainability leads
- Waste-management and container providers
- Training partners
How to start
- Putting dedicated bins, clear signage and the two hard exclusions (batteries out, infectious never in) into the clinical workflow at pilot sites
- Exploring innovations for tech-supported collection
KPIs to measure
- Point-of-use segregation and compliance rate
- Contamination / reject rate at the processor
- Trained sites live

Cardinal Health Sustainable Technologies
Cardinal Health shows what infrastructure investment looks like once it compounds. In fiscal year 2025 the company collected 21.6 million single-use devices for reprocessing, diverting 6.6 million pounds of waste from landfill[66], while the Association of Medical Device Reprocessors reports nearly 10,000 hospitals, surgical centres and US military surgical hospitals used reprocessed SUDs in 2024[66]. In 2024, US hospitals and surgical centres saved nearly half a billion dollars through reprocessing — more than USD 443 million from lower-cost reprocessed devices, plus roughly USD 8 million from waste-cost reduction[66].

Ambu ReCircle
The ReCircle programme, operated by Resourcify, applies the same logic to one product line rather than a portfolio. It covers single-use endoscopes — bronchoscopes, cystoscopes, rhinoscopes and laryngoscopes — with laryngoscope blades added subsequently, across Germany, the UK, France and the US[84].
How collection works. Sites are onboarded and trained by the manufacturer, then run collections themselves: the hospital raises a pickup in the programme portal, and filled boxes are exchanged one-for-one for empties at the point of collection.
How recycling works. Because these are electronic single-use products, processing follows an electrical-equipment route rather than a clinical-waste one. Decontamination comes first, and it sits downstream by necessity: hospitals that have moved fully to single-use no longer hold a decontamination unit, so the protocol relies on a wipe-down at the point of use followed by machine decontamination at the processor, evidenced by a certificate issued with the batch. Separation then combines partial manual disassembly with on-site shredding, and it is the manual step that lifts the recovery rate, because it removes the components that would otherwise contaminate a fraction. Recovery differs by market: the same device yields differently from one country to the next, depending on the separation depth the local plant can deliver and how much falls out to energy recovery.
Programme figures as published by Ambu, June 2026.[84]

GRIN
GRIN, a Norwegian circular-tech start-up founded in Oslo in 2018, has developed smart collection systems that can take back a wide range of products, in hospitals and beyond[151]. Inspired by the reverse vending machine, its systems are fitted with sensors that detect and validate each return and can trigger a reward for it. That makes them a natural link to deposit refund systems (DRS), turning a return from a disposal step into a recorded, incentivised transaction[150].
Tested in practice. GRIN first piloted its systems for reusable packaging in retail and food service. As a partner in the DiCE project, it has carried that know-how into smart collection boxes and software for medical devices, where concrete collection and reverse-logistics approaches have been developed and tested in large-scale pilots[150].

Bring the data backbone to reality (UDI, DPPs) with practical use cases Internal
Treat traceability as infrastructure and an enabler for business value, not as reporting. Without a digital chain of custody across every handover, a recovery rate is a modelled figure rather than a proven one — and the distinction is exactly what a regulator, an auditor or a procurement team will increasingly press on. It is also where regulation is heading: EPR frameworks are beginning to attach traceability obligations directly, rather than leaving proof to good practice. Build the layer before the volume arrives; reconstructing evidence you did not capture is not possible after the fact.
The Unique Device Identifier (UDI) is the data infrastructure validated circular supply chains depend on. It is already mandatory across the US and EU and expanding through APAC, and it tracks an individual device from manufacture through use and reprocessing. Japan's PMDA already requires each remanufactured SUD to carry a unique serial number linking the used device's hospital collection record to its manufacturing and distribution history. Reprocessors and OEM reprocessing programmes that build their traceability on top of UDI, rather than a parallel system, turn a compliance requirement into a portable, auditable provenance record hospitals and regulators can both trust.
EFPIA and EAHP have launched a new guideline on bar coding to facilitate use in hospitals at the unit level — another important step. Looking ahead, digital interfaces such as the Digital Product Passport should not only carry product, use and safety information, but should also include disposal instructions and reprocessing recommendations.
Producers that embrace DPPs proactively may unlock practical use cases that carry real business value — starting with a stronger connection to customers and users. AI-powered optical inspection and software-controlled cleaning systems that standardise and document the cleaning process, rather than relying on manual inspection, are what let a reprocessor withstand audit and win hospital and payer trust at scale[77][78].
Accountable owners
Digital and product-data management, with regulatory affairs for UDI and DPP alignment.
Essential external partners
- UDI issuing agencies (GS1, HIBCC)
- DPP and traceability-platform providers
- Standards bodies
- The reprocessing and recycling partners who feed the record
How to start
- Build traceability on top of UDI, not as a parallel system.
- Prove one practical use case: a verified recovery rate, or a customer-facing disposal and reprocessing instruction.
KPIs to measure
- Share of devices with a live chain-of-custody record
- Recovery rates proven rather than modelled
- DPP-enabled use cases live
Pioneer and lead collective, open systems – one bin, shared ownership External
Co-shape open systems that make collection simple at the source. Current manufacturer-led programmes show that take-back works. But they also show that scale is needed and simplicity for the medical staff is key. Scaled brand by brand, however, they seem to reach their limits. Each producer brings its own container, portal and acceptance rules, and theatre staff end up facing a row of bins that no protocol can keep them compliant with.
The model that may scale is an open system: one bin for all eligible SUD at the point of use, collected as a single stream, with the complexity moved downstream to specialised sorting partners who route each fraction to its recycling or reprocessing pathway. Openness does not mean accepting everything from day one. Prioritise the device families where it demonstrably works: clear material composition, no infectious-risk exposure, and enough volume to sort economically. Widen the scope as sorting yields prove it.
Lead, and start bilateral. Governance is harder than logistics, so keep it simple at first. Pioneers are needed that lead: a single manufacturer and a partner, or two manufacturers and one hospital group that partner up, can agree on scope, cost-sharing and data rules far faster than a sector-wide initiative. Once the loop is proven, the system opens to further producers and regions. The branded open system should be owned by the manufacturers in the consortium. They set acceptance criteria, cost allocation and data-sharing rules, and they build a collective business case rather than each defending a stand-alone one. Pioneers write those rules; later entrants accept them. Keep the collaboration pre-competitive and clear with competition counsel from the outset, because shared infrastructure among competitors will be examined.
Align design choices, and appoint an orchestrator. The consortium is also the right forum to align on design choices, such as material families, separability and labelling, so that one bin produces an output that can actually be sorted. Running the system day to day likely needs an orchestrator: a neutral party that onboards sites, manages sorting partners and holds the chain-of-custody data. Its job is to keep the system fast, industry-driven and scalable rather than committee-bound.
Accountable owners
Sustainability and circularity leadership with commercial, and legal for consortium and competition terms.
Essential external partners
- Peer manufacturers
- Sorting, recycling and reprocessing partners
- Hospitals and health systems
- An orchestrator or platform provider
- Container and logistics providers
How to start
A bilateral pilot with one hospital group, one bin and a narrow device scope, with governance, cost-sharing and a published route for others to join written down from day one.
KPIs to measure
- Manufacturers participating
- Share of eligible SUD volume captured through the shared bin
- Sorting yield and reject rate
- Cost per kg versus single-brand programmes
- Sites live
Do we need a pan-European circular system for SUDs?
What would its success factors be?And how could we build a collective, open system together?
- HospitalUsed devices, all manufacturers
- One bin: sorting & collection
- ConsolidationBundled volumes
- Decontamination
- Shredding & separation
- Recycling at scale
- Material reuse & reporting
- ↺ back to the hospital
Open system
One bin. One shared stream.
Many manufacturers, back-allocation · Digital chain of custody · Producer-specific reporting · Neutral governance · Cross-border orchestration
Why open systems
Brand-by-brand take-back hits its ceiling at the point of use, not in the recycling plant.
- Bin space is the bottleneck. Theatres and wards have no room for a separate container, portal and rulebook per manufacturer.
- Scale pays twice: for the environment and for cost. Economies of scale drive down costs. Around 50–70% of costs lie in logistics, for example, and pooling volumes from multiple areas of the hospital into one pick-up drives that cost down.
Why pan-European
The alternative is a patchwork of national island solutions that never reach network effects.
- Harmonise the rule set and interface for manufacturers to control complexity and costs. National systems with their own rules, containers and reporting add complexity.
- Small markets become viable inside a network. Pooling brings low-volume countries into reach where they would never work alone. Clear standards for hospital groups, procurement and OEMs mean more consistent acceptance criteria, reporting and data.
What makes an open system work
A digital backbone is the prerequisite, not an add-on.
ENKORE: industry and the EU working on shared use cases
ENKORE is a public-private partnership between the life sciences industry and the EU, with key project partners including universities, healthcare institutions, tech companies and research organisations[223]. Its use cases focus on three areas:
- transforming drug injection devices (pre-filled syringes and autoinjectors)
- single-use products for dialysis and IV therapies
- scaling recycling of medical devices and packaging in hospitals
MedTech capital equipment

Capital equipment includes some of the highest-value assets in healthcare, from MRI machines and CT scanners to ultrasound units, surgical robots and patient monitoring systems. A new MRI system costs around USD 1–3 million, or roughly USD 1 million per tesla of field strength[108].
Much of that value is also in the materials inside these machines. They contain copper windings and waveguides, tungsten and molybdenum in anodes and collimators, rare-earth permanent magnets, helium, lutetium-based scintillation crystals and electronics containing gold and palladium. Many of these materials are classified as critical raw materials and have no drop-in substitutes.
A decommissioned scanner can therefore be a materials bank as well as a refurbishable asset. The global market for refurbished medical equipment was valued at USD 21.3 billion in 2025 and is projected to reach USD 50.0 billion by 2033, growing at a compound annual rate of 11.3%[85].
circularity opportunities
Follow the forward path from OEM to healthcare use, and the reverse loop through take-back, logistics and refurbishment. Hover or click an opportunity to explore the relevant call to action.
 SupplierMaterials / components
 OEM / ManufacturingDesign / produce
 Distribution / serviceSell / lease / maintain
 Healthcare providerUse
 Waste handlerHarvest / recycle
 RefurbisherRepair / refurbish / reuse
 Logistics providerReverse movement / returnsIncinerationResidual waste
Build separable subsystems, standard interfaces, documented disassembly and upgradeable software into the next platform generation. These choices determine whether equipment and components can be recovered economically years later.
Offer availability-based contracts, such as uptime guarantees or per-procedure pricing, supported by remote monitoring and predictive maintenance. This creates recurring revenue while helping hospitals keep equipment available.
Commit to a minimum period of maintenance, updates and cybersecurity support. Give qualified hospital teams and independent servicers access to parts, manuals, diagnostics and software tools under defined commercial and quality terms.
Build systematic returns into the installed-base model, rather than waiting for occasional trade-ins. Route recovered systems into certified refurbished equipment and harvested spare parts, while recovering materials from what cannot be reused.
Give each machine a persistent identity and portable record of its configuration, service history, software, materials and ownership. Keep that information accessible across hand-offs so servicing, take-back and second-life decisions are possible.
Global MedTech trends and developments
From an OEM perspective, the value generation does not stop with sale of the equipment. Capital equipment stays in clinical service for ten to fifteen years[117]. Much of the revenue, margin and material value comes after the initial sale. While the equipment is in service, that value comes from service and uptime contracts and from software and hardware upgrades to installed systems. Further value can come from giving equipment a certified second life and recovering components when it is finally retired. What opens all of it up is a working connection to the installed base:
- a reasonably current picture of where systems are and how hard they are running
- a commercial relationship that allows the manufacturer to keep them up to date
- an agreed route for the asset to come back when the customer is ready to move on
Manufacturers that build those three things give themselves a fifteen-year revenue stream and a source of their own scarcest materials.
Where the connection is looser, more of that value is realised by whoever is closer to the asset at the time — brokers, independent servicers and the secondary market — which is a good description of where much of it sits today, and therefore of how much is still available.
MedTech regulation & legislation
Rules on medical equipment repair and refurbishment are changing quickly, and markets are moving in different directions. The US and EU are moving fastest towards making it a legal right to keep equipment running and refurbish it. What was once a commercial choice is increasingly becoming a legal entitlement.
India and China are moving quickly too, towards tighter import restrictions. India has halted imports of refurbished devices pending a licensing framework, and China’s draft medical device law proposes banning those imports[110][111]. The stated aims are to protect patients and prevent these markets from becoming disposal routes for ageing equipment from elsewhere. Pressure to protect domestic manufacturers also plays a role[110].
For manufacturers already building the capacity to give equipment a second life, the changes in their core markets are largely favourable. The terms for operating in growth markets are still taking shape.
The right to repair: an active policy debate. Regulation in this vertical is shaped by the balance between OEM intellectual-property rights and the interest of hospitals and independent service organisations (ISOs) in repairing and refurbishing equipment. Manufacturers have historically relied on software locks, proprietary diagnostic tools and comprehensive service contracts to keep servicing inside their own quality systems — a model that also supports a profitable service business, and one that legislators are now revisiting.
The "Right to Repair" movement has gained real momentum. Repair restrictions are under growing scrutiny, and new FDA rules make it clearer when a repair turns into remanufacturing.
Read more on US
A 2026 report from the US Public Interest Network documents the current state of medical device repair restrictions, flagging concern about biomedical labour shortages and about how concentrated servicing has become[86].
The FDA’s QMSR (in force since 2 February 2026)[120] clarifies the regulatory framework for remanufacturing and servicing, giving clearer guidance on when a repair crosses the threshold into remanufacturing and triggers re-registration[60].
The ESPR and the Critical Raw Materials Act. New EU rules require equipment to be more durable, repairable and recyclable, and actively support recovering critical raw materials.
Read more on EU
- Ecodesign for Sustainable Products Regulation (ESPR). It sets the clearest direction of travel for capital-equipment circularity, with requirements for durability, repairability and recyclability aimed at extending product lifespans. It is not yet a dated obligation for this sector. Its requirements, including the Digital Product Passport, apply only through product-specific delegated acts, and medical devices and capital equipment are not among the priority groups of the first ESPR Working Plan 2025–2030 (iron and steel, aluminium, textiles, furniture, tyres, mattresses and a set of energy-related products)[226]. Producers who build DPP-ready data now are investing ahead of regulation rather than complying with it, the same discipline this paper applies to the PPWR in §3.1.
- Critical Raw Materials Act (CRMA). Adopted in 2024, it sets strategic benchmarks for domestic production, processing and recycling of critical raw materials, and explicitly supports circular recovery as a way to cut dependence on imported supply[89].
MedTech Europe’s 2025 recommendations for the EU Circular Economy Act call for regulatory coherence between the Green Deal legislation and the MDR/IVDR, specifically targeting the barriers to refurbishment and remanufacturing created by the current framework[18]. The “end-of-waste” ambiguity is particularly acute here, since harvested spare parts from decommissioned machines can’t always be legally reclassified as products for use in repairs.
Frameworks still being written. India is restricting imports of refurbished devices and China has proposed a ban, while LATAM regulators have no specific refurbishment rules yet.
Read more on APAC and LATAM
Elsewhere the rules for refurbishment are being written now, and not all of them in a permissive direction.
- India. India is the clearest example of how quickly the rules can change. In 2023, an import route opened for certain types of high-end used equipment under the environment ministry’s hazardous waste rules. In January 2025, the CDSCO told Customs that refurbished devices could not be imported for sale or distribution because the Medical Devices Rules 2017 provide no licensing pathway for them. A health ministry committee is now reviewing the policy. Domestic manufacturers want to keep the restriction, while multinationals are pushing for a regulated import route and inclusion in the government’s Electronics Repair Services Outsourcing (ERSO) initiative[110].
- China. China’s draft Medical Device Administration Law goes further still, proposing to prohibit refurbished equipment from being imported, distributed or used in hospitals[111].
- LATAM. In a USD 48 billion device market in 2025, ANVISA and COFEPRIS are converging on international standards without yet carrying specific refurbishment regulation[90].
Manufacturers can help shape the rules in these important markets today.
MedTech infrastructure
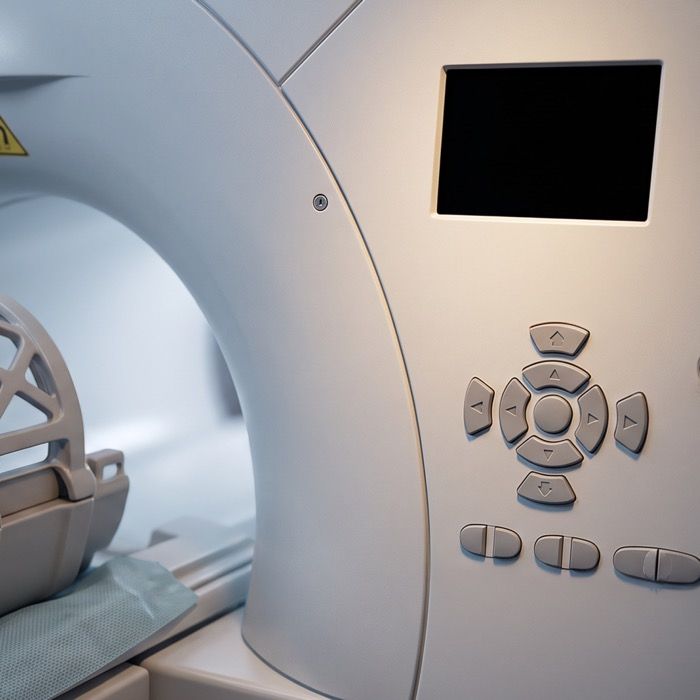
Certified refurbishment is a proven model, but capacity is still concentrated. Most of it sits with a handful of OEM centres in the US and Europe, supplemented by independent servicers. There is room to build more capacity in the markets that use the most refurbished equipment.
OEM-led refurbishment centres. Infrastructure here is primarily OEM-led and highly concentrated. The three largest diagnostic imaging OEMs, Siemens Healthineers, GE HealthCare and Philips, operate dedicated global refurbishment centres, mostly in the US and Europe. Together they represent the most sophisticated circular infrastructure anywhere in healthcare. GE HealthCare’s GoldSeal programme has run for over 20 years and has sold more than 18,000 systems globally in that time[115], and is backed by a dedicated Circularity Innovation Lab; Philips and Siemens Healthineers operate comparable certified lines and component-recovery operations, with the reported volumes set out in the case in point later in this section.
Refurbishment goes beyond imaging equipment. For example, Stryker runs one of the most industrialised second-life operations in MedTech. Stryker Sustainability Solutions operates FDA-registered reprocessing and remanufacturing facilities serving more than 3,250 hospitals in the US and Canada, taking devices back, restoring them inside Stryker’s own quality system and reselling them under warranty (the same logic as the single-use device reprocessing described in section 3.2).
Its reprocessed catalogue includes[109]:
- pulse oximeter sensors
- ECG lead sets, cables and adaptors
- electrophysiology catheters and cables
- intracardiac echo ultrasound catheters
- ultrasonic scalpels and vessel-sealing devices
- compression sleeves
- patient-repositioning mats
The role of independent service organisations (ISOs). Beyond the OEM programmes a significant ISO ecosystem provides repair and refurbishment, and it is critical for maintaining older equipment no longer supported by its manufacturer, particularly in resource-constrained settings. How much comprehensive refurbishment ISOs can actually perform is set by OEM decisions on access to manuals, software and diagnostic tools.
Where the capacity is not: a north–south asymmetry. In LATAM, MEA and much of APAC, most capital equipment servicing is limited to local repairs. Full certified refurbishment requires specialised industrial facilities, reverse logistics for heavy equipment and highly skilled biomedical engineers. The market for refurbished devices in MEA alone was worth USD 1.21 billion in 2025[91]. These regions are therefore consumers of refurbished systems supplied from the Global North rather than producers of them.
That asymmetry is precisely why several importing countries are tightening their rules. Regulators and domestic manufacturers in India have argued openly that an unregulated inflow of depreciated equipment risks turning the market into a disposal route for other countries’ fleets, with the e-waste that follows[110].
Certified refurbishment, local servicing capability and an OEM that remains accountable for the machine when it finally reaches the end of its useful life are all required. Together, these distinguish a genuine second life from an export of waste.
MedTech market

The commercial model is shifting from selling equipment to selling availability. Hospital finance directors are most willing to pay a premium for the assurance that equipment will be available when patients need it. Sustainability increasingly strengthens that business case.
The Product-as-a-Service shift is the structural development. Under PaaS and outcome-based contracting, the manufacturer retains ownership of the equipment and charges the hospital for outcomes (per scan, per procedure) or for guaranteed availability.
Retained ownership aligns commercial and environmental incentives. When the manufacturer keeps ownership of the machine, it pays for maintenance, upgrades and end-of-life management. Designing equipment to last longer and making it easier to upgrade and repair can lower those costs, protect margins and keep the machine in use for longer.
Retained ownership also solves the visibility problem — an asset the manufacturer never sold is an asset it never loses sight of. EY identifies PaaS as one of the key trends driving circularity in MedTech, alongside purposeful design and collaborative ecosystems[92]. The constraint is financial rather than technical: retained ownership moves the asset onto the manufacturer’s balance sheet and converts a single recognised sale into a decade of deferred revenue, which is why the model spreads fastest where the OEM has the balance-sheet capacity or a financing partner to carry it.
Uptime is what makes that proposition sell. Hospitals are under cost pressure, but what they will pay a premium for is availability. Capital equipment is financed against a depreciation schedule that assumes a certain throughput; it is operated by radiographers, technologists and clinicians whose wages are paid whether or not the machine is running; and it occupies a shielded, purpose-built room that cannot be repurposed while it is down. Unplanned downtime therefore hits both sides of the P&L at once — idle staff and fixed-cost recovery on one side, foregone appointments and lost utilisation on the other — and carries clinical risk whenever a diagnosis is delayed or a patient transferred. Where wage costs are high and depreciation schedules aggressive, guaranteed availability is worth paying for in its own right; where installed systems are scarce, a single scanner out of service can hold up a service line for a whole catchment area, so the value of availability is if anything greater.
Source: [86]
Modularity and upgradeability are becoming a commercial strategy, not only an engineering one. The large system providers are moving away from selling a fixed configuration that is eventually replaced wholesale, and towards platforms that can be kept current in place:
- new clinical capability delivered as software
- computing and reconstruction hardware refreshed as a module
- detectors, coils or consoles renewed without replacing the gantry or the magnet
Philips sells this explicitly as a subscription: its Technology Maximizer programme bundles software upgrades, the computer-hardware refresh needed to run them, cybersecurity enhancements and new clinical features across CT, MR, diagnostic X-ray, image-guided therapy and ultrasound for a predictable fee. It is marketed on avoiding repeated capital approvals and keeping a mixed fleet on a common release level[93]. Siemens Healthineers and GE HealthCare offer comparable defined upgrade paths across their installed platforms.
The commercial logic is what makes the direction durable: an upgrade path is recurring revenue running through the manufacturer’s own service channel. It keeps the relationship with the customer alive through another cycle rather than reopening the account at the next tender. Recurring revenue and retention are what make modular design straightforward to fund; the circular benefit — an avoided new build — follows from the same decision.
Underneath both sits a price argument, and a market growing on it. A refurbished MRI or CT scanner can be acquired for 25–60% less than a new system[95][114], which is what makes advanced imaging reachable for budget-constrained providers. Grand View Research values the global refurbished medical equipment market at USD 21.3 billion in 2025, reaching USD 50.0 billion by 2033[85]; other estimates differ on scope but not on direction[94]. North America is the largest single market at roughly 40% of revenue, for a structural reason — a large installed base with short upgrade cycles and organised trade-in channels is what generates the supply any secondary market depends on[95]. The fastest growth, however, is in Asia Pacific: Grand View Research puts the region at a 12.4% CAGR to 2033, against roughly 11.3% for the market as a whole[112].
MedTech supply chain & operations
Two factors shape the economics most: critical raw materials for which there is no easy substitute, and the gradual loss of visibility over an installed base once it is sold. Three further challenges then determine how readily recovered equipment can be given a second life.
Critical raw material exposure. The capital-equipment supply chain is uniquely exposed to critical raw material (CRM) risk. There is no drop-in substitute for most of these.
| Equipment | Depends on |
|---|---|
| MRI systems | Helium for superconducting magnets; rare earths for permanent magnets |
| PET scanners | Lutetium-based scintillation crystals[96] |
| CT and digital X-ray detectors | Rare-earth and gadolinium-based scintillator ceramics |
| X-ray tubes | Tungsten, molybdenum and rhenium anodes |
| Linear accelerators | Tungsten collimators and copper waveguides |
| Ultrasound probes and ultrasonic surgical handpieces | Piezoceramics |
| Surgical robots, powered instruments and mobile monitoring equipment | Rare-earth permanent magnets with lithium and cobalt cells |
What that exposure now costs. These materials are geographically concentrated and increasingly politicised. China accounted for roughly 60% of mined output of magnet rare earths in 2024 and a far higher share of refining, and in April 2025 it introduced export licensing for seven medium and heavy rare earths — samarium, gadolinium, terbium, dysprosium, lutetium, scandium and yttrium — three of which sit directly in medical imaging detector and magnet materials[97]. The price effect was immediate and has not reversed: through 2025, dysprosium oxide delivered to North America traded at around 4.4 times the Chinese ex-works price, with a comparable gap for terbium in Europe, and forecasts point to that premium widening rather than closing[87]. Helium tells the same story from a different direction — a conventional MRI cryostat holds on the order of 1,500 litres, the price roughly doubled between 2020 and 2023 across a succession of supply shocks — from USD 7.57 to a record USD 14 per cubic metre on USGS figures[119] — and renewed disruption in 2026 pushed prices up a further 50–70% alongside supplier allocation cuts to MRI operators[98]. For an OEM or its component suppliers, this has become a direct input-cost and lead-time question rather than a marginal hedging one — which is what makes recovery of these materials commercially interesting rather than merely virtuous.
Expired metal stock is the cleanest entry point. The same logic reaches beyond capital equipment. Expired and decommissioned surgical instruments and implants are today mostly destroyed at cost and sold as mixed scrap, so titanium Grade 5, stainless steel and cobalt-chrome come out as commodity metal. What is lost is not the metal but what made it usable: the certified grade, the qualified form and the documented chain of custody. Expired stock arrives with all of it, including a known alloy, a known manufacturer, a documented history and, in many cases, no patient contact at all. Some parts need not be remelted. Components rejected for cosmetic defects can be stripped, re-coated and returned to service, with the plating metal recovered from the stripping liquor and fed back into the coating line[229], which gives two loops from one intervention, with no design change and no new submission.
Visibility over the installed base tends to fade after the sale. Once a system is sold it frequently changes hands — traded in, resold through brokers, exported to a second or third market — and unless the OEM holds a live service contract, it typically does not know where the machine is, who owns it now, what condition or configuration it is in, or when it will be decommissioned. Few OEMs have a contractual trigger, an agreed valuation mechanism or a standing operational process for recovering an asset at the end of its first life; in most organisations, take-back is handled case by case, usually only when a trade-in is bundled into a new sale. The result is that a good deal of equipment which is technically refurbishable, and whose components carry exactly the critical raw materials the OEM is short of, moves beyond easy reach, with the residual value realised by third parties. That is also the opportunity: the value is demonstrably there, and recovering a larger share of it is less a matter of logistics investment than of asset visibility, contractual design and sustained customer-relationship management across the full installed life.
However, there are three challenges to re-deployment of recovered and refurbished equipment:
Imaging systems store patient data where standard IT wiping tools often can’t reach it. The manufacturer is best placed to sanitise its own equipment and certify that it has done so.
Read more on data security
Imaging systems, monitors and their workstations write protected health information to internal and embedded storage, and the HIPAA Security Rule requires a documented final disposition for that data and for the hardware holding it — an obligation that follows the device when it is scrapped, returned to a lessor or resold[99].
Proprietary embedded storage is often unreachable by standard IT wiping tools, so sanitisation to NIST SP 800-88 levels has to be designed into the decommissioning protocol by someone who knows the system. That cuts in the OEM’s favour rather than against it: the manufacturer is the party best placed to sanitise its own equipment verifiably, and to certify in writing that it has done so.
Machines far outlast the operating systems they ship with. Patching and upgrade policies, which the manufacturer sets, increasingly decide when a machine’s clinical life ends.
Read more on software and cybersecurity
Capital equipment stays in clinical service for ten to fifteen years, often outlasting support for the operating system it shipped with. WannaCry showed what was at stake. It infected more than 1,200 diagnostic devices and affected at least 81 of England’s 236 NHS trusts.[117][116]
Long-lifecycle Windows editions buy time. Eventually, though, changing the operating system on a regulated device can trigger revalidation and a regulatory change assessment. That can make replacing the whole machine administratively simpler than upgrading it.[101]
Manufacturers control several decisions that affect how long a machine can stay in service.
- How long they commit to providing security patches
- How quickly they validate and release those patches
- Whether the computing components and operating system can be upgraded independently of the modality hardware
- How they plan and communicate End-of-Service
A machine can reach the end of its clinical life because its software can no longer be kept secure, even when the hardware still works. Designing a platform that can stay current can add years of saleable service life.
End-of-Life notices and restricted service information limit who can keep older equipment running. 79% of biomedical technicians are denied service information “somewhat frequently” or “most of the time”, although the evidence suggests third-party servicing is safe[86].
Read more on parts and service
Availability tightens as OEMs issue End-of-Life and End-of-Service notifications. In practice, these notifications have also served as a prompt for replacement.
The 2026 US PIRG survey of 107 biomedical technicians found that:
- 79% were denied access to service information for critical equipment “somewhat frequently” or “most of the time”, up from 64% in 2020.
- Every respondent had been denied access to that information at some point.
- Every respondent serviced devices already past their declared End of Life, and 77% did so often.[86]
Safety concerns are often cited as the reason for restricting access. However, an ECRI review of 2.1 million device incident reports filed between 2006 and 2015 attributed only 0.005% of failures to servicing or maintenance. The FDA’s 2018 assessment concluded that third-party servicing is high quality and critical to the functioning of the health system.[86]
As discussed earlier, the regulator is pressing OEMs to open documented, standard diagnostic and service interfaces. Access to those interfaces determines how far in-house biomedical teams and independent servicers can work alongside the OEM, and how practical multi-vendor fleet management becomes. Opening them on commercial terms turns a contested topic into a licensable product line (§3.3.2, call 04).
MedTech technology
One data layer does all the work. The telemetry that sells guaranteed uptime is the same telemetry that makes take-back, resale and parts harvesting possible — and modular architecture is what lets the manufacturer act on it.
Remote and predictive maintenance: the commercial entry point. Continuous monitoring of equipment health — performance metrics, vibration, temperature, error codes — lets failures be predicted and pre-empted rather than repaired after the fact, and remote diagnosis resolves a share of faults without an engineer travelling at all. GE HealthCare, Philips and Siemens Healthineers already run this inside their service contracts. Its immediate value is the uptime proposition in (C); its second value is that the manufacturer now has a live signal from every connected system it has sold.
That signal is the answer to the visibility problem. Four things matter in practice:
The current installation site, and whether the system has been traded, resold or exported since it left the factory.
Scan or procedure counts and the accumulated duty on wear-limited components such as X-ray tubes, gradient coils and detectors. This is what separates a ten-year-old machine in light use from one run in three shifts.
Hardware configuration, software version and security patch level.
The realistic remaining life, and which of its CRM-intensive assemblies are worth recovering.
A digital twin turns that stream into a usable asset record — engineers can simulate the effect of different repair or upgrade strategies before committing, and a refurbishment centre can price and schedule a second life against real condition data rather than an inspection on arrival. The same record underpins the residual-value and buy-back mechanics in §3.3.2, and, in time, the machine-readable lifecycle record that a digital product passport will require.
Modular architecture as an enabling principle. Knowing a machine is worth recovering is only useful if it can be economically separated, upgraded and returned to service. That means separable subsystems, documented disassembly, interfaces that survive a generation change, and — the highest-value case — upgradeable compute so that new clinical capability can be delivered as software to hardware already in the field.
Software-enabled lifecycle extension is the strongest circular lever in this vertical precisely because it decouples technological obsolescence from physical degradation.
A ten-year-old system delivering current-generation diagnostic performance through software updates avoids an entire new build, which no downstream recovery activity can match.
Circular MedTech scaling strategies — calls for action

Circularity here focuses on extending the product lifecycle through refurbishment, remanufacturing, parts harvesting and the shift to service-based business models. But lifetime extension is only half the proposition. Circular strategies in this vertical also aim to increase the revenue earned over that longer life. Manufacturers can offer additional services for equipment already installed and adopt business models that charge for outcomes, such as per scan, per procedure or for guaranteed uptime. They can also bring more of the activities that generate value in-house, including refurbishment, certified resale, parts remarketing, financing and end-of-life recovery. The question this section answers is where that additional value sits today, and how a manufacturer can capture more of it given the conditions set out above.
From heatmap to action: where the value sits. The MedTech view of the chapter 2 heatmap is unusually concentrated.
The heatmap rates each of the 3 circular levers against 7 business value drivers, such as cost, revenue and tenders. The bars count how many of those 21 ratings are “strong”.
Three areas score at the maximum, but in each, current practice captures only part of what the lever can deliver:
| What it can deliver | Current practice | |
|---|---|---|
| Refurbishment and resale | The strongest lever on both cost (refurbished systems sell at 25–60% below the price of new[95][114]) and revenue (certified second-life tiers are established, monetised product lines), and increasingly accepted in public tenders. | Second lives are taken opportunistically, when a trade-in happens to be bundled into a new sale, rather than systematically across the installed base. |
| Product-as-a-service | The clearest recurring-revenue lever and the strongest loyalty lever, because a multi-year outcome-based contract sustains the relationship for a decade or more. | Outcome-based contracts cover a minority of installed systems, while for the majority ownership — and with it all future service, upgrade and end-of-life value — transfers at the moment of sale. |
| Parts harvesting | The strongest resilience lever, hedging precisely the critical raw material exposure set out in §3.3.1 (D). | Run as a cost-reduction programme inside the service organisation rather than as a materials strategy with a target and a reported figure. |
Reuse scores lower on the producer’s commercial dimensions: donation and redistribution build goodwill and access rather than revenue, which makes them a reputational and market-development play rather than a P&L one.
The opportunity is the gap between those scores and current practice, and it is a fair measure of the headroom still available. The enabling conditions for all three — knowing where an asset is, what state it is in, and holding an agreed route to take it back — are, as §3.3.1 (D) sets out, still being built in most organisations. Each call to action below is tagged with the heatmap ratings it is intended to improve.
Five calls to action for MedTech OEMs. Each addresses a specific value pool identified in the chapter 2 heatmap and a specific constraint identified in section 3.3.1. They are ordered along the product lifecycle — from the design decisions that set the ceiling for everything downstream, through the commercial, data and support models that monetise a longer life, to the single take-back and recovery commitment that captures value from equipment already in the field.
Design modular, upgradeable platforms — for the second life, not just the first sale Internal
Design decisions taken once, at the drawing board, determine how much of the installed base is still economically recoverable a decade later — which makes this the lever with the longest lead time and the highest ceiling. The design brief that follows from the evidence is specific:
- modular architectures with separable subsystems
- documented disassembly
- standard interfaces that survive a generation change
- upgradeable compute and software
- where technically possible, designing scarce materials out altogether
Helium-free and sealed-magnet MRI designs are the clearest current example, cutting cryogen dependence by orders of magnitude and removing one of the supply risks described above[98]. The proof point sits in a 2025 life-cycle assessment published in Resources, Conservation and Recycling, which compared rethink, reuse, refurbish and recycle options for MRI devices against a linear baseline. It found that the options increasing a device’s utilisation rate — rethink and reuse — are by a clear margin the most beneficial for both climate impact and critical raw material use, while recycling is the least beneficial[102]. Extending life and utilisation beats recovering materials at end of life; but only a product designed for it can deliver either.
Producer accountable owner
R&D and product architecture, with the platform lead for each imaging modality (MRI, CT, X-ray, ultrasound).
Essential external partners
- Component and magnet suppliers
- Contract manufacturers
- The notified body that must assess whether a design change is significant enough to require re-certification
- LCA provider
How to start
- Add second-life criteria to the design brief of the next platform generation: separable subsystems, documented disassembly, upgradeable compute, declared CRM content
- Score the current portfolio against them
KPIs to measure
- Share of new platforms meeting the design-for-recovery brief
- Disassembly time per system
- Share of assemblies recoverable to as-new specification
- Declared CRM content per unit

Philips BlueSeal — engineering a critical raw material out of the product
A conventional 1.5T MRI magnet depends on the order of 1,500 litres of liquid helium over its operational life, topped up from a supply that has spiked repeatedly since 2020 and is exposed to the same geopolitics as the rare earths described in §3.3.1 (D). Philips’ sealed BlueSeal magnet, first installed in 2018, permanently encloses seven litres in the cryogenic circuit and loses none of it — not even during a quench. Around 2,000 BlueSeal systems are now installed worldwide, and Philips reports more than six million litres of liquid helium saved against a conventional magnet baseline[103]. The second-order effects are what make it a commercial story as much as a sustainability one: the magnet is roughly a tonne lighter and needs no quench pipe, which opens installation sites that could not previously take an MRI at all — upper floors, constrained retrofits, mobile trucks — and removes helium refills from the operating cost line and from the risk register.
Sell uptime, not machines Internal
Hospitals are under cost pressure, and what they will most readily pay a premium for is availability. Build the commercial proposition around guaranteed uptime rather than around the box: condition-based remote maintenance for instant support, predictive maintenance that intervenes before a failure cancels a list, and pricing that reflects availability (uptime SLAs, per-scan or per-procedure models). GE HealthCare, Philips and Siemens Healthineers already deliver remote monitoring and predictive maintenance inside their service contracts, and the resulting data feeds back into the design of the next equipment generation — a second return on the same investment. This is the vertical’s clearest recurring-revenue lever and its strongest loyalty lever at once. The framing matters commercially: uptime is the argument that lands most readily with a hospital CFO, with sustainability strengthening the case rather than having to carry it.
Producer accountable owner
Service operations and commercial/pricing, with finance for the balance-sheet consequence.
Essential external partners
- Financing or leasing partner
- Hospital IT and biomedical engineering
- Connectivity and cloud provider
How to start
Convert one modality in one market to a guaranteed-availability contract with a defined uptime SLA, priced against the customer’s real cost of downtime rather than against the hardware.
KPIs to measure
- Share of installed base under availability or outcome contracts
- Contracted versus achieved uptime
- Recurring revenue per installed system
- Contract length and renewal rate
Connect the installed base: persistent identity plus a live lifecycle record Internal
Take-back fails on information before it fails on logistics, so build the information layer first. An identifier on its own is not enough. What is needed is a connected asset: a machine that reports its own state, and an identity that the reported state can be attached to and read against for as long as the machine exists. Each system should carry a machine-readable lifecycle record that travels with the asset and remains readable after it changes hands, covering:
- service history
- configuration
- software and cybersecurity state
- material and component composition
- ownership
Digital-twin and digital product passport infrastructure built on verifiable credentials makes that record portable without exposing commercially sensitive data. The ESPR’s Digital Product Passport is rolling out: the EU central registry has been live since 19 July 2026, and the battery passport becomes binding from 18 February 2027. Further product groups will follow as their delegated acts are adopted, most of which are still in drafting[30]. That rollout makes this an investment ahead of regulation rather than a nice-to-have: medical devices are not yet on the ESPR Working Plan[226], but the infrastructure is being built now, and the same record unlocks calls 04 and 05.
Producer accountable owner
Digital and product data management, with regulatory affairs for UDI and DPP alignment.
Essential external partners
- DPP and verifiable-credential platform providers
- UDI issuing agency (GS1, HIBCC)
- Standards bodies (CEN/CENELEC JTC24)
- Hospital asset-management vendors
How to start
- Define the minimum lifecycle record: identity, configuration, service history, software and cybersecurity state, material composition, ownership
- Pilot it on a single modality
KPIs to measure
- Share of installed base carrying a live lifecycle record
- Record completeness
- Share of returns arriving with verified condition data
- Time to establish an asset’s residual value
Guarantee a support window — and open service access on commercial terms External
These are two halves of one commitment: that a machine the manufacturer has sold can be kept running, safely and lawfully, for as long as it is clinically useful — by the OEM’s own engineers where the customer wants that, and by qualified others where it does not. Both are what §3.3.1 (D) identifies as sitting largely within the manufacturer’s own hands, and both are more often handled as lifecycle notifications than as products — which is where the opportunity lies.
Publish a minimum support window, then sell into it. End-of-Life and End-of-Service dates are generally read by customers as a prompt to replace, which limits the weight they carry as planning information. Committing publicly to a guaranteed minimum support period — and then monetising that period through software-delivered clinical capability and structured upgrade programmes of the kind described in §3.3.1 (C) — converts a source of friction into recurring revenue from the installed base. Cybersecurity currency belongs inside the same commitment, and should be stated explicitly: because operating-system obsolescence rather than physical wear is increasingly what ends a machine’s clinical life, a platform that is patchable and separable from its compute is what makes a long, saleable second life possible.
Open service access on commercial terms, ahead of the regulation. OEMs can license parts and charge for access to service manuals, diagnostic tools and software keys. They can make these available to in-house biomedical teams and independent servicers that meet defined competency and quality requirements. As regulators push for broader access to servicing, manufacturers can earn revenue from parts sales and licensing. Licensing also addresses the operational reality behind the 79% denial rate reported by biomedical technicians[86]. Hospitals that are confident their equipment can be kept running, by whoever is nearest, are the most willing to buy an availability-based contract. That makes generous access a direct support for call 02. With US right-to-repair legislation and the ESPR setting the direction, manufacturers that move early are best placed to shape the commercial terms on which access is given.
Producer accountable owner
Product management and product security, with service operations and legal/IP, and the commercial owner of the parts business.
Essential external partners
- Operating-system and component vendors
- Notified body for change assessment
- Hospital IT security and in-house biomedical teams
- Independent service organisations
- Training providers
- Industry associations
How to start
- Publish a guaranteed minimum support period per platform, explicitly covering security patching
- Publish licensing terms for manuals, diagnostic tools, service keys and parts for qualified third parties
- Build the software upgrade roadmap that monetises the window
KPIs to measure
- Published versus actual support window
- Share of installed base on a supported software state
- Patch validation latency
- Revenue from software-delivered capability upgrades
- Parts and licensing revenue
- Number of qualified third-party servicers
- Part and documentation fulfilment time
- Customer-reported downtime

Siemens Healthineers — Circuline and ecoline
Siemens Healthineers runs two complementary second-life lines under one asset-lifecycle programme. ecoline is OEM-certified refurbishment: used imaging and therapy systems (CT, MR, molecular imaging, angiography, mammography) rebuilt through a defined multi-step quality process under ISO 13485, with certified parts and full warranty, to a standard positioned as comparable to new[104]. Circuline is a lighter-touch tier of hand-selected, reconditioned pre-owned systems, usually reinstalled in the same region to keep transport emissions and lead times down[104]. The ecoline portfolio won the industry's Circularity Champion Award in the "Design for Circularity" category. Underneath the product lines sits the parts operation that makes them work: Siemens Healthineers recovered more than 435,000 components in 2024 and repaired and reused 69% of them[118], and ranks second on the INDEED Innovation Circularity Index MedTech 2026 at 54.8 of 102.6 points[105].
GE HealthCare — GoldSeal
GE HealthCare's operational figures show what a mature take-back line looks like once it has run for decades. The GoldSeal programme has sold more than 18,000 systems globally over 20 years, and in 2024 alone GE HealthCare recovered approximately 8,050 imaging, ultrasound, magnet and surgery systems, yielding 7,803,106 kg of reused and recycled material against 474,943 kg sent to landfill — a 94% material recovery rate by weight[115]. That rate is the number that matters strategically: at 94% by weight, take-back stops being a disposal cost and becomes a parts-and-product supply. It is worth reading precisely, though — the figure covers material reused and recycled, not only components that re-enter clinical service.
Commit to take-back at scale: certified second life as a product tier, harvested parts as a hedge External
This is the one commitment that closes the loop, and it only works as a whole. Getting equipment back without a refurbished product line leaves stock without a sales channel. A certified refurbished line without a reliable flow of returns runs short of equipment. Without those two pieces, harvesting parts remains a cost rather than a materials strategy. And if all three are built only in the Global North, the model reaches its limits in the fastest-growing markets. Taken together, they turn take-back from an occasional trade-in into a supply chain with its own revenue line.
Design the return at the point of first sale, not at end of life
That means contractual return rights, pre-agreed residual values or buy-back triggers, and an obligation to notify the manufacturer on resale or export. It then means staying in contact with the equipment across its whole life, including after a transfer of ownership — offering service, parts, training and software to the second and third owner is both a revenue line and the mechanism that keeps the asset visible.
The operating principle is simple: stay ahead of the replacement conversation rather than waiting for the customer to open it.
A manufacturer that knows the age, condition and utilisation of every system it has built can time that conversation well, capture the trade-in, and keep the CRM-bearing components inside its own quality system.
Buy the logistics, own the certification
The physical half does not need to be built from scratch in every market. De-installation, heavy transport, warehousing and condition grading can be bought from specialist reverse-logistics and asset-recovery providers. That leaves the OEM to concentrate its own capability where it is genuinely differentiated: diagnostics, remanufacture to original specification, regulatory certification and warranty. Transparency is what makes that split work. Shared asset data, an agreed condition-grading standard and an auditable chain of custody let the manufacturer keep its visibility while handing over the heavy lifting.
What comes back has two destinations: refurb or parts
Both should be sold as product. The first is a certified second-life tier. Refurbished and remanufactured lines should be positioned, priced and warranted as a distinct tier with explicit performance parity, rather than as a defensive response to the secondary market. Bringing the value-generating steps in-house (refurbishment, certified resale, parts remarketing, financing and take-back) keeps the margin on the second life with the manufacturer rather than passing it to brokers. It also gives the sales organisation a credible answer for budget-constrained customers who would otherwise buy used from someone else. Certified remanufacturing warrants its own place in that portfolio: it is the only route that restores a system to as-new specification and warranty while keeping the magnet, detector or tube assembly inside the manufacturer’s own quality system rather than the scrap stream.
The second destination is the component inventory. Systems not worth restoring whole should be treated as stock rather than scrap, with explicit internal targets for the share of service demand met from harvested parts — particularly on the CRM-critical assemblies (magnets, detectors, X-ray tubes, gradient coils) most exposed to export controls and price spikes. The precedent exists at scale:
Reporting the figure externally converts an internal efficiency into a resilience claim procurement teams can score.
Build the capacity in the growth markets, not just for them
LATAM, MEA and much of APAC consume refurbished systems but do not produce them, which caps volume, lengthens lead times and leaves those markets dependent on Global North upgrade cycles. Manufacturers can localise certified refurbishment, parts distribution and biomedical engineering training, in partnership with health ministries, development finance institutions and local service organisations. Doing so addresses the capability gap that currently limits growth and builds the workforce that keeps the installed base running. It also positions the manufacturer favourably while refurbishment regulation in these markets is still being written.
Producer accountable owner
Service operations and commercial contracting, with legal for return rights, product management and pricing for the second-life tier, procurement for harvested parts, and regional market leadership for in-region capacity.
Essential external partners
- Reverse-logistics and asset-recovery providers
- De-installation and heavy-transport specialists
- Notified body or certification partner
- Financing partners for second-life customers
- Second-market dealers and distributors
- Certified recyclers and critical-raw-material recovery specialists
- Health ministries, development finance institutions and biomedical engineering training institutions in the growth markets
How to start
- Run the full loop once, on one modality: write return rights, a residual-value or buy-back trigger and a resale-notification obligation into the standard sales contract
- Appoint a reverse-logistics partner in one region
- Launch the certified second-life tier with published parity and warranty terms and give the sales organisation a target for it
- Set an internal target for the share of service demand met from harvested CRM-critical parts
- Choose one growth market for an in-region refurbishment and parts hub with a local training programme
KPIs to measure
- Share of new sales carrying contractual return rights
- Assets located as a share of installed base
- Recovery rate at end of first life and residual value recovered per year
- Second-life revenue and margin as a share of modality revenue
- Price realisation and warranty claim rate versus new
- Share of tenders entered with a certified refurbished offer
- Share of service parts demand met from harvested stock, avoided procurement cost and recovered mass of CRM-bearing assemblies
- In-region certified capacity and biomedical engineers trained locally

What if the 2040 reality is more radical than we all think?
This discussion paper is written for the people who decide what gets made. The action areas within and across Packaging, SUD and MedTech provide ideas that go beyond incremental improvements. While day-to-day changes often seem incremental, thinking 10–15 years ahead does not. Thinking future-back often calls for decisions that shape radical improvements. But what if the future reality is even more radical than many of us anticipate?
Each card states one projection the sector already publishes, from the UN, the WHO, the Lancet Countdown, the European Commission and the sector's own market studies. Hover over a card, or tap it, for the figures behind it.
By 2030 one person in six is aged 60 or over and the 80+ population triples to 426 million by 2050[122]; by the late 2070s people over 65 outnumber children under 18 globally[129]. Africa holds 28% of the world's under-25s today and 46% by 2100, with nine countries doubling their population by 2054[129] [130].
Self-injection devices grow from $27.9 bn to $45.9 bn between 2026 and 2031 as biologics leave the infusion centre[132]; personalised medicines were 36% of new FDA approvals in 2025, the sixth year above one-third[133]; and 19 of the 23 modifiable drivers of health sit outside the formal system altogether[141].
Advanced therapies reach ~45% of pharma sales by 2030[142]; 73% of non-communicable-disease deaths are in low- and middle-income countries[134], where the single-serve sachet heads from 855 bn to 1.3 trillion units a year[135] and one health facility in four in fragile settings has basic waste services[136].
UDI is already mandatory in the US and EU and the Digital Product Passport rolls out by product group[18]; Deloitte's Future of Health 2040 describes a system built on "radically interoperable data", where value migrates from physical assets to information[139].
Dengue cases nearly doubled in a year to 12.7 million and the population at risk rises from 4 bn to 5 bn by 2050[140]; manufacturing is re-regionalising, with US greenfield announcements up from $18 bn to $180 bn in a year[142] and the EU Critical Medicines Act writing resilience into procurement[126].
Eunomia and Systemiq's figure covers producing, converting and disposing of seven single-use plastic categories across the EU27, UK, US and Canada; it is a value-chain cost rather than a product-level total cost of ownership, and the closest published proxy to a sector TCO. Their high-ambition scenario saves up to $18 bn a year by 2040, with 53% less waste and 55% lower emissions[11].
Imagine a pharma plant in 2030 where no one is on the line, and MedTech production fully automated. Connected equipment and AI read every sensor signal in real time and reconfigure production overnight; robots run nearly all routine work end to end, and each batch can be tailored to the patients it is for. The factory has become a self-running system, and the technology for it is already being built. Not just automated assembly: automated disassembly shifts the cost structure of production too. AI-led lighthouse plants already report up to 43% lower manufacturing cost, 30–44% shorter lead times and 41% less energy use[148] [149].
Focus on the patient becoming the central operator, not the medical staff. An 80-year-old at a kitchen table, not a nurse on a ward, is the person opening the pack, injecting the dose and deciding where the pen goes next[122] [131] [123]. Every device, every instruction and every return route has to work with no clinician in it. The system is challenged to deliver simplicity.
Co-develop new infrastructure in areas where nothing is collected, and where the largest volumes of the 2030s appear. Chronic disease is already 73% a low- and middle-income story[134], the formats those markets buy are single-dose[135], and one facility in four in fragile settings has basic waste services[136]. A "recyclable" label on a European pack describes none of that volume.
Rethink geographical footprint strategies. Circular infrastructure where consumption happens and devices are used. On-demand production. Automated production and automated disassembly powered by industrial AI. Will this challenge outsourcing and globalisation strategies, and result instead in reshoring and regional coverage strategies[142] [126]? Circularity is no longer a sustainability preference; it becomes the supply chain itself.
Prepare for the increasing cost of waste handling and turn it into an advantage. The $76 bn system cost becomes a real cost on the buyer's side[11]. The quality of the data that proves circular loops gets better. Whoever leads from design to closed loops, not whoever collects most, will own the tender.
Anticipate that ten years compress into two, and raise ambition levels. A pandemic moved care home in months; one drug class put a billion injections a year on the table[125]. The next shock lands on a system that has either pre-agreed its loops, its bins and its data, or improvises them under pressure, badly.
Circularity does not just prevent value loss — it creates new value, in cost savings, resilience, and recovered material. That value has to be shared, not concentrated, or the system that created it in the first place won't hold together. This report opened with a structural imbalance:
- Patients want safety above all
- Producers design and profit but lose control at the point of sale
- Providers use and dispose but can't redesign products or reroute materials
- Payers fund the system but reward low unit cost over lifecycle value
Four actors, four incentives, no shared system to align them. Closing that loop means sharing the savings and new revenue from circular models. Those gains need to reach hospitals that adopt new workflows and insurers that consider lifecycle value alongside unit price in reimbursement and tendering. Ultimately, they need to reach patients, who otherwise bear the costs and risks of a system still optimised for disposal.
None of that redistribution can start, though, without something to redistribute visibly: shared reporting on who actually captured what value — cost saved, revenue earned, resilience gained — has to exist before fairness can be discussed, not get bolted on afterward as a transparency gesture. Producers who treat this as a shared-value exercise — rather than a way to capture all the upside internally — will find hospitals and payers far more willing partners in scaling the loops this paper describes.
Design & make
Producers & Brand Owners
Design the product and the loop: keep material in circulation, put data on shared rails, and take the first share of value, then decide how far it travels.
Use & dispose
Providers & users
Return material and data through workflows that cost no clinical time, and see the value come back as better tenders and less waste cost.
Health first
Patients
Material reaches them safely; money reaches care as lower lifecycle cost and resilient supply, and more of it at home.
Fund & reward
Financing & insurers
Price lifecycle cost and resilience into reimbursement and tenders, so the money flow rewards the loop rather than the unit.
Circular material flows require circular information flows. This allows us to uncover and recover value. The loop then becomes a financial value pool for producers and brand owners. But only the leaders who show hospitals, payers and patients their share of the value may find the willing partners for scale.
This requires a collaborative mindset. In that spirit, if you have ideas that could help advance this discussion — please reach out and get in touch.
- Waste Dive. "Only 5% of healthcare plastic gets recycled: Eunomia report." wastedive.com
- Health Care Without Harm & Arup. (2019). "Health Care's Climate Footprint: How the health sector contributes to the global climate crisis and opportunities for action" (health care = 4.4% of global net emissions, more than aviation or shipping; later Lancet Countdown estimates put the range at ~4.6–5.2%). global.noharm.org
- Eckelman MJ, Huang K, Lagasse R, Senay E, Dubrow R, Sherman JD. (2020). "Health Care Pollution and Public Health Damage in the United States: An Update," Health Affairs 39(12):2071–2079 (US health care = ~8.5% of national greenhouse-gas emissions, 2018). healthaffairs.org
- Health Care Without Harm. "Health care plastic FAQs" (health care consumes ~15 million tonnes of plastics per year). global.noharm.org
- The Business Research Company. (2026). "Circular Economy Global Market Report 2026" (market at $517.79bn in 2025 growing to $578.09bn in 2026, 11.6% CAGR). thebusinessresearchcompany.com
- EY (Ernst & Young). "Driving Innovation in MedTech: The Power of Circularity and Sustainable Product Design" (~90% of medical device waste comprises disposable, one-time-use products or components). ey.com
- Eunomia. (2026). "Why healthcare's sustainability challenge starts with procurement." eunomia.eco
- PAHO. (2025). "How countries in the Americas are strengthening their capacity for safe medical waste management." paho.org
- Packaging Europe. (2024). "Are designers truly responsible for 80% of a pack's environmental footprint?" packagingeurope.com
- Boston Consulting Group for MedTech Europe. (2025). Decarbonising Healthcare: How a Competitive MedTech Industry Can Contribute (design levers for products and packaging, including dematerialisation, design for longevity and circularity, offer a further 25–30% emission reduction, after ~40% from green power, heat and efficiency). medtecheurope.org
- Eunomia Research & Consulting and Systemiq. (2025). "A Prescription for Change: Rethinking plastics use in healthcare to reduce waste, greenhouse gas emissions and costs." eunomia.eco
- Hoveling, T., IJzenbrandt, J., Hinrichs-Krapels, S., Ritzen, L., Bramer, W. M., van Raaij, E., Faludi, J., Bakker, C., & Diehl, J.-C. (2026). "Mapping circular economy product and material flows in healthcare: A visual taxonomy." Journal of Cleaner Production, 538, 147258. doi.org/10.1016/j.jclepro.2025.147258
- Digital Health in the Circular Economy (DiCE). "About the Project"; see also DiCE (2026), "DiCE Circular Design Guide — Heal Without Harm Design Circular." circulardigitalhealth.eu/about; circulardigitalhealth.eu/dice-design-guide
- Future Market Insights. (2026). "Explore the Global Medical Packaging Market." futuremarketinsights.com
- Towards Packaging. (2026). "Sustainable Medical Packaging Market Trends & Size 2026–2035." towardspackaging.com
- McKinsey & Company. (2025). "Sustainability in Packaging 2025: Inside the Minds of Global Consumers." mckinsey.com
- European Commission. (2026). "New EU rules on packaging enter into application." environment.ec.europa.eu
- MedTech Europe. (2025). "Priorities for the EU Circular Economy Act." medtecheurope.org
- H2 Compliance. (2025). "US States with Packaging EPR Laws: What Businesses Need to Know in 2025." h2compliance.com
- Faegre Drinker Biddle & Reath LLP. (2026). "Extended Producer Responsibility (EPR): Six State Reports Due May 31." faegredrinker.com
- PPAI (Promotional Products Association International). (2026). "10 States To Watch For New Packaging EPR Laws In 2026." ppai.org
- DLA Piper. (2026). "Oregon EPR: District Court Issues Preliminary Injunction Partially Halting the Plastic Pollution and Recycling Modernization Act." dlapiper.com
- Greenhouse Accelerator. (2024). "Innovation Unpacked: Navigating the Future of Sustainable Packaging in APAC." greenhouseaccelerator.com
- HB Fuller. (2026). "Flexible Packaging Trends for 2026: From Momentum to Maturity." hbfuller.com
- Alliance to Zero. "Spotlight: Secure Blister-Free Syringe Packaging." alliancetozero.com
- SCHOTT Pharma. (2024). "SCHOTT Pharma Introduces Blister-Free Syringe Concept." schott-pharma.com
- Olympus Corporation. (2025). News release. olympus-global.com
- World Pharma Today. "Digital Container Twins Improving Vial Sealing Visibility." worldpharmatoday.com
- PlasticsEurope. (2025). "Plastics — the Facts 2025." plasticseurope.org
- European Commission. (2026). "Digital Product Passport." single-market-economy.ec.europa.eu
- Nève, A., & Violato, N. (2025). "The Puzzle of Sustainable Pharma Packaging: Drivers, Trade-Offs, and Best Practices." Pharmaceutical Engineering (ISPE). ispe.org
- Packaging Insights. (2026). "Kenvue Taps Greyparrot's AI Platform to Advance Circular Packaging Design." packaginginsights.com
- European Union. (2025). "Regulation (EU) 2025/40 of the European Parliament and of the Council on Packaging and Packaging Waste." Official Journal of the European Union, via EUR-Lex. eur-lex.europa.eu
- European Medicines Verification Organisation (EMVO). "About EMVO." emvo-medicines.eu
- MIT Center for Transportation & Logistics. (2023). "Reducing CO2 Emissions in Cold-Chain Pharma Logistics." dspace.mit.edu
- myclimate. "SkyCell: The CO2-Efficient Alternative to Medicine Deliveries by Air Freight." myclimate.org
- Peli BioThermal. "Services — Rental+." pelibiothermal.com
- VinylPlus Healthcare. "Pharmaceutical Blister Recycling." vinylplushealthcare.eu
- DuPont. "University Healthcare System Conducts Plastics Recycling Pilot." dupont.com
- Zenbird Media. (2026). "Japan Firms Produce Chemical Raw Materials From Used Medicine Packaging." zenbird.media
- Digimarc. (2025). "Digimarc Recycle Earns Industrial-Scale Validation in HolyGrail 2.0 Trials." digimarc.com
- World Health Organization. (2024). "Safe Management of Wastes From Health-Care Activities," 2nd ed. who.int
- Children's Health Queensland. (2024). "Landmark Blister Package Recycling Scheme Introduced at Queensland Children's Hospital." childrens.health.qld.gov.au
- Vinyl Council of Australia. "PVC Recycling in Hospitals." vinyl.org.au
- SCHOTT Pharma. (2024). "SCHOTT Pharma, Corplex and Takeda Successfully Demonstrated Closed-Loop Recycling." schott-pharma.com
- SABIC. "SABIC & Zuyderland Collaborate to Drive Circularity for Hospital Plastic Waste, Presenting Closed-Loop Pilots With Ecosystem Partners." sabic.com
- Healthcare Plastics Recycling Council (HPRC) & Plastics Industry Association. "Case Study: Chicago Regional Recycling Project." hprc.org
- Healthcare Plastics Recycling Council (HPRC). "Case Study: Recycling Pilot for Non-Hazardous Medical Plastic Waste" (B. Braun Medical & Lehigh Valley Health Network, with PureCycle Technologies). hprc.org
- U.S. Food and Drug Administration. "Reprocessed Single-Use Devices: Frequently Asked Questions" (FD&C Act §201(ll) definition). fda.gov
- European Union. Regulation (EU) 2017/745, Article 2(8) — Definitions ("single-use device"). medical-device-regulation.eu
- "Closing the Loop on Personal Protective Equipment: Collection, Polymer Recovery, and Circular Pathways for Post-Consumer PPE." (2026). Polymers, 18(3), 336. mdpi.com
- "Recycling of personal protective equipment: Sanitisation, degradation and polymer blend formulations." Polymer Degradation and Stability. sciencedirect.com
- Multy Prep. "The History of Sterile Processing: From Ancient Times to Modern Tech." multyprep.com
- Centers for Disease Control and Prevention. "Sterilizing Practices." cdc.gov
- worldstainless (International Stainless Steel Forum). "Recycling." worldstainless.org
- TU Delft. "A Circular Healthcare Economy; a feasibility study to reduce surgical stainless steel waste." research.tudelft.nl
- Precedence Research. "Single Use Disposable Medical Devices Market." precedenceresearch.com
- MedDeviceGuide. "FDA Medical Device Classification: Product Codes, Device Classes, and Regulatory Pathways." meddeviceguide.com
- MedDeviceGuide. "EU MDR Notified Bodies and Conformity Assessment Guide." meddeviceguide.com
- FDA. (2026). "Remanufacturing and Servicing Medical Devices." fda.gov
- Fortune Business Insights. "Medical Device Reprocessing Market Size, Share & Industry Analysis." fortunebusinessinsights.com
- Obsidian RI. (2026). "Life Sciences Regulatory Compliance in Asia-Pacific: 2026 Guide." obsidianri.com
- MedDeviceGuide. "Top Medical Device Companies in 2026: Revenue Rankings, Market Share, and Industry Trends." meddeviceguide.com
- IMT Medical Devices. "Medical Device Distribution: A Global Guide to Supply Chain and Procurement." imtmedicaldevices.com
- TechTarget. "Leveraging Group Purchasing for Hospital Supply Chain Management." techtarget.com
- Cardinal Health. (2026). "Leveraging medical device reprocessing to reduce healthcare's carbon footprint." newsroom.cardinalhealth.com
- DataBridge Market Research. "Asia-Pacific Medical Waste Management Market." databridgemarketresearch.com
- Enviliance ASIA. "Extended Producer Responsibility (EPR) — Asia coverage." enviliance.com
- Research and Markets. "Middle East Single-Use Medical Device Reprocessing Market." researchandmarkets.com
- InsightAce Analytic. "GLP-1 Autoinjector and Pen Injector Market." insightaceanalytic.com
- Grand View Research. "Longevity and Wellness Pharmaceutical Market Report." grandviewresearch.com
- Grand View Research. "Aesthetic Medicine Market Size & Share Report, 2026–2033." grandviewresearch.com
- Grand View Research. "Aesthetic Needles and Cannulas Market Size Report, 2033." grandviewresearch.com
- Fortune Business Insights. "Wearable Injectors Market." fortunebusinessinsights.com
- GMInsights. "Smart Medical Device Market." gminsights.com
- Association of Diabetes Care & Education Specialists (ADCES), danatech. "Dexcom G7 & Libre 3 Comparison." adces.org
- Sterilization Summit USA. (2026). "Cold Power: Why Hydrogen Peroxide Is Winning." sterilization-summit.com
- MD+DI. "A New Device-Cleaning Technology." mddionline.com
- Hänsel, M., Bambach, T., & Wachtel, H. (2019). "Reduced Environmental Impact of the Reusable Respimat® Soft Mist™ Inhaler Compared with Pressurised Metered-Dose Inhalers." Advances in Therapy, 36(9), 2487–2492. Manufacturer-authored (Boehringer Ingelheim) lifecycle assessment — methodology disclosed (IPCC AR5, GHG Protocol Product Standard), but not an independent study. link.springer.com
- OINDPnews. (2020). "Boehringer Ingelheim's Reusable Respimat SMI Wins 2020 Pharmapack Eco-Design Award." oindpnews.com
- Royal College of Physicians. "Reducing the Use of Disposable Insulin Pens in North East & Yorkshire." rcp.ac.uk
- Simpson, V. & Jones, A. (2024). “Switching to Reusable Cartridge Insulin Pens Can Reduce National Health Service Costs While Delivering Environmental Benefits.” Diabetic Medicine. DOI: 10.1111/dme.15409. onlinelibrary.wiley.com
- Johnson & Johnson MedTech. "Cycle.On — Recycling Programme." jnjmedtech.com
- Ambu A/S. "Ambu® Recircle Program" (take-back and recycling for single-use endoscopes and video-laryngoscope blades). ambuusa.com. Programme launched June 2025; expansion to video-laryngoscope blades and participating-site figures per Ambu, Oct 2025: ambu.com.
- Grand View Research. "Refurbished Medical Equipment Market Report, 2026–2033." grandviewresearch.com
- US Public Interest Network. (2026). "Hospital Repair Restrictions II." publicinterestnetwork.org
- Benchmark Mineral Intelligence. (2026). "Ex-China Rare Earths Premium to Grow, Especially for Heavies." linkedin.com (Benchmark Mineral Intelligence)
- Philips. (2025). "Innovation Spotlight: How a Circular Economy Is Driving Sustainable Healthcare." philips.com
- Jones Day. (2026). "The EU Critical Raw Materials Act and Its Impact on the Mining Sector." jonesday.com
- MedDevice Guide. (2026). "LATAM Medical Device Registration: Country-by-Country Comparison Guide." meddeviceguide.com
- Market Data Forecast. (2026). "Middle East and Africa Refurbished Medical Devices Market Report." marketdataforecast.com
- EY. "Driving Innovation in MedTech: The Power of Circularity and Sustainable Product Design." ey.com
- Philips. "Technology Maximizer — Upgrade Services" (cross-modality upgrade programme for CT, MR, diagnostic X-ray, image-guided therapy and ultrasound). philips.com
- The Business Research Company. "Refurbished Medical Equipment Global Market Report 2026." thebusinessresearchcompany.com
- Mordor Intelligence. "Refurbished Medical Devices Market Size & Share Analysis." mordorintelligence.com
- SFA (Oxford). "The Lutetium (Lu) Market." sfa-oxford.com
- International Energy Agency. "With New Export Controls on Critical Minerals, Supply Concentration Risks Become Reality." iea.org
- Radiology Business. (2026). "Helium Prices Spike as War Rages On — Should MRI Providers Be Worried?" radiologybusiness.com
- HIPAA Journal. "HIPAA Rules for Disposing of Electronic Devices and Media" (with reference to NIST SP 800-88, Guidelines for Media Sanitization). hipaajournal.com
- 24x7 Magazine. (2025). "The Cybersecurity Threat Lurking in Legacy Medical Devices." 24x7mag.com
- Microsoft. "Windows 10 — Release Information" (edition lifecycle and end-of-servicing dates). learn.microsoft.com
- Horn, S. et al. (2025). "Circular Economy Solutions for Magnetic Resonance Imaging: Mitigation of Environmental Impacts and Critical Raw Material Use." Resources, Conservation and Recycling, Vol. 215. sciencedirect.com
- Philips. "Helium-free MRI — BlueSeal Technology" (7 litres sealed helium charge; ~2,000 systems installed; >6 million litres of liquid helium saved). philips.com
- Siemens Healthineers. "Circuline" (reconditioned pre-owned imaging systems) and "ecoline" (OEM-certified refurbished systems), Asset Lifecycle Development. siemens-healthineers.com/circuline; ecoline refurbished systems.
- INDEED Innovation. (2026). "The Circularity Index MedTech 2026: What Separates Leaders from Laggards." indeed-innovation.com
- GE HealthCare. "Focusing on Sustainability and a Circular Economy in Healthcare." gehealthcare.com
- Resourcify. (2023). "Customer story: for more circularity in hospitals." resourcify.com
- Sarracanie, M., LaPierre, C. D., Salameh, N., Waddington, D. E. J., Witzel, T. and Rosen, M. S. (2015). "Low-Cost High-Performance MRI." Scientific Reports, 5, 15177, open access (clinical MRI scanners operate at 1.5–3 T, with a purchase price approaching USD 1 million per tesla). doi.org/10.1038/srep15177
- Stryker. "Reprocessed products" and "Say yes to reprocessing" (Stryker's Sustainability Solutions; FDA-regulated reprocessing for more than 3,250 hospitals across the US and Canada; product families include pulse oximeter sensors, ECG leads and cables, EP catheters and cables, ICE ultrasound catheters, ultrasonic scalpels, vessel sealing devices, compression sleeves and patient-repositioning mats). stryker.com; stryker.com
- The Tribune (India). (2025). "Halt import of refurbished medical devices: drug regulator to Customs dept"; and Medical Buyer. (2026). "Refurbished medical device import policy remains under discussion" (CDSCO letter of 10 January 2025; MoEFCC hazardous-waste import route and revised 38-device list; health-ministry policy review committee; domestic industry's 'dumping ground' objection). tribuneindia.com; medicalbuyer.co.in
- Ropes & Gray. (2026). "China's NMPA Requests Public Comments on its First Medical Device Law" (draft Medical Device Administration Law, Articles 105, 134 and 151: refurbished medical equipment prohibited from being imported, distributed and used at hospitals). ropesgray.com
- Grand View Research. "Asia Pacific Refurbished Medical Equipment Market Size & Outlook, 2033" (USD 4.49bn in 2025 to USD 11.46bn by 2033, 12.4% CAGR 2026–2033; India the highest-CAGR country). grandviewresearch.com
- European Commission, Joint Research Centre. "Sustainable Product Policy" (over 80% of all product-related environmental impacts are determined during the design phase); see also European Commission, Ecodesign Your Future brochure, and the Ecodesign for Sustainable Products Regulation (ESPR) impact assessment, which uses the same "up to 80%" figure. joint-research-centre.ec.europa.eu
- Philips. "Circular Edition systems" and "Philips Circular Edition" brochure (Circular Edition systems on average 25% lower in price than comparable new Philips systems); and Philips. (2025). "Innovation spotlight: how a circular economy is driving sustainable healthcare" (a typical refurbished Azurion 7 C20 has a 28% lower lifetime carbon footprint than a new one and 60% lower supply-chain emissions, which Philips equates to Scope 3 emissions for a healthcare customer). usa.philips.com; Circular Edition brochure (PDF); philips.com
- GE HealthCare. (2025). 2024 Sustainability Report — Executive Summary (approximately 8,050 imaging, ultrasound, magnet and surgery systems recovered in 2024; total reuse weight 7,803,106 kg, landfill weight 474,943 kg, total 8,278,048 kg; US GoldSeal programme has sold more than 18,000 systems globally over 20 years). gehealthcare.com
- National Audit Office. (2017). Investigation: WannaCry Cyber Attack and the NHS, HC 414, Session 2017–19 (more than 1,200 pieces of diagnostic equipment infected; at least 81 of the 236 NHS trusts in England affected directly or indirectly). nao.org.uk
- CDA-AMC (formerly CADTH). (2021). The Age of Imaging Equipment in Canada (Canadian Association of Radiologists guidance: life expectancy of 8, 10 and 12 years for high-, medium- and low-usage imaging systems respectively, with maximum life expectancy and clinical relevance not expected to exceed 15 years; includes the COCIR "Golden Rules" age-profile criteria). cda-amc.ca
- Siemens Healthineers. (2024). Sustainability Report 2024 (fiscal year 2024; see Chapter 3.2 Circularity for component recovery, repair and reuse figures). siemens-healthineers.com
- MIT Technology Review. (2024). "The era of cheap helium is over — and that’s already causing problems" (citing US Geological Survey data: helium price nearly doubled since 2020, from USD 7.57 per cubic metre to a historic high of USD 14 in 2023; four global helium shortages since 2006). technologyreview.com
- US Food and Drug Administration. "Quality Management System Regulation (QMSR)" and QMSR Frequently Asked Questions (final rule published 2 February 2024; revised 21 CFR Part 820 in force from 2 February 2026, incorporating ISO 13485:2016 by reference; QSIT inspection technique withdrawn on the same date). fda.gov
- Healthcare Plastics Recycling Council (HPRC). (2019, updated 2022). "Healthcare Plastics: Guidance for Recyclers" (about 1 million tons of clean, non-infectious healthcare plastics generated in US healthcare facilities each year). hprc.org
- World Health Organization. (2024). "Ageing and health" fact sheet (by 2030, 1 in 6 people worldwide will be aged 60 or over; the population aged 80+ is expected to triple between 2020 and 2050 to 426 million). who.int
- World Health Organization. "Health workforce" (projected global shortfall of around 11 million health workers by 2030, concentrated in low- and lower-middle-income countries). who.int
- MarketsandMarkets. (2025). "Home Healthcare Market — Global Forecast to 2030" (market projected to reach US$473.8 billion by 2030 at an 8.9% CAGR). marketsandmarkets.com
- TTP. "Scaling GLP-1 drugs without a mountain of waste." ttp.com
- Council of the European Union. (12 May 2026). "Critical medicines act: Council and Parliament reach provisional deal" (resilience-related requirements in public procurement; collaborative procurement threshold lowered to five member states; incentives for EU-based manufacturing). consilium.europa.eu
- US Food and Drug Administration. (April 2025). "FDA Announces Plan to Phase Out Animal Testing Requirement for Monoclonal Antibodies and Other Drugs" and accompanying Roadmap to Reducing Animal Testing in Preclinical Safety Studies (new approach methodologies including AI-based computational models and organ-on-a-chip). fda.gov
- Drug Target Review. (2026). "2026: the year AI stops being optional in drug discovery." drugtargetreview.com
- United Nations, Department of Economic and Social Affairs, Population Division. (2024). World Population Prospects 2024: Summary of Results (world population 8.2 billion in 2024, peaking at ~10.3 billion in the mid-2080s; persons 65+ to outnumber children under 18 by the late 2070s; populations of nine countries doubling 2024–2054). population.un.org
- Pew Research Center. (2026). "5 facts about Africa's population growth" (analysis of UN WPP 2024: Africa 19% of world population; 28% of the world's under-25s today, 46% by 2100; 3.8 billion people by 2100, medium variant). pewresearch.org
- McKinsey & Company. "How 'Care at Home' ecosystems can reshape the way health systems envision patient care" (an estimated $265 billion of care services, up to 25% of the total cost of care for Medicare FFS and MA beneficiaries, could shift from facilities to the home; institutional sites continue to be required for needs that cannot be met at home). mckinsey.com
- Mordor Intelligence. (2026). "Self-Injection Device Market — Size, Share & Forecast 2026–2031" (US$27.87 billion in 2026 to US$45.88 billion by 2031, 10.49% CAGR; pen injectors 47% share; wearable injectors fastest-growing at 12.2% CAGR). mordorintelligence.com
- Personalized Medicine Coalition. (2026). Personalized Medicine at FDA: The Scope & Significance of Progress in 2025 (16 new personalized medicines, ~36% of newly approved therapeutic molecular entities; more than one-third for the sixth consecutive year, versus under 10% fifteen years earlier). personalizedmedicinecoalition.org
- World Health Organization. "Noncommunicable diseases" fact sheet (NCDs killed at least 43 million people in 2021; 73% of NCD deaths and 82% of premature NCD deaths before age 70 occur in low- and middle-income countries). who.int
- Phys.org / AFP. (2024). "Big brands are 'failing to curb plastic sachet use'" (Break Free From Plastic audit; an estimated 855 billion sachets sold globally each year, projected to reach 1.3 trillion by 2027, Southeast Asia consuming nearly half; multi-layer construction makes them hard to recycle). phys.org
- World Health Organization. "Health-care waste" fact sheet (about 85% of health-care waste is non-hazardous; only 25% of health facilities in fragile contexts had basic health-care waste management services in 2023; 61% of hospitals in high-income countries had basic services in 2021). who.int
- World Health Organization / Lancet Countdown. (29 October 2025). "Climate inaction is claiming millions of lives every year, warns new Lancet Countdown report" (heat-related mortality rate up 23% since the 1990s, averaging 546,000 deaths a year; 640 billion potential labour hours lost to heat in 2024, US$1.09 trillion in lost productivity; 124 million more people food-insecure in 2023). who.int
- European Commission. "European Health Data Space Regulation (EHDS)" (in force 26 March 2025; from March 2029, cross-border exchange of patient summaries and ePrescriptions/eDispensations in all member states and secondary use of most data categories; remaining categories such as genomic data from 2031). health.ec.europa.eu
- Deloitte. "The Future of Health — 2040 timeline and Forces of Change" (radically interoperable data; value moves from physical assets to information and always-on platforms; US health spending projected at ~US$11.3 trillion by 2040). deloitte.com
- World Economic Forum. (November 2024). "The world is in the grip of a record dengue fever outbreak" (12.7 million cases January–September 2024 versus 6.5 million in all of 2023; endemic in 130+ countries; cases in France, Spain and Italy more than doubled; population at risk of mosquito-borne infection ~4 billion today, estimated 5 billion by 2050). weforum.org
- McKinsey Health Institute. (2026). "The future of healthy living: A $16.4 trillion opportunity" (19 of 23 modifiable drivers of health sit outside the formal healthcare system; eliminating behavioural, metabolic and environmental risk factors could add 12 years of life expectancy, avert 1.5 billion DALYs ≈ 47% of the 2050 disease burden, and generate ~US$16.4 trillion in annual GDP uplift by 2050). mckinsey.com
- McKinsey Global Institute. (2026). "Pharmaceuticals: Innovating and advancing around the world" (global pharma sales growing ~5% CAGR; advanced therapies from 30% of sales in 2018 to >40% in 2024 and ~45% by 2030; therapeutic antibody sales >US$267 billion in 2024; EU-27 and US each ~30% and China ~20% of pharmaceutical GVA; US greenfield announcements US$18 billion in 2024 to US$180 billion in 2025; supply-chain security and industrial policy now weigh alongside cost in siting decisions). mckinsey.com
- McKinsey & Company. (2026). "Reimagining life science enterprises with agentic AI" (75–85% of pharma and 70–80% of MedTech workflows contain agent-automatable tasks, freeing 25–40% / 25–35% of capacity; operations task time reduced 25–35%; trial design 50% faster with 25% fewer amendments; pharma EBITDA uplift 3.4–5.4 points). mckinsey.com
- National Academy of Medicine. "The Case for Hospitals to Boost Single-Use Device Reprocessing Programs" (since 1998, FDA regulation and an independent GAO analysis have found no increased patient-safety risk from reprocessing; "only a fraction" of reprocessable devices are reprocessed; AMDR members saved US hospitals over US$398 million and 113 million lb CO₂e in 2024; barriers include contract clauses, warranty threats and "chipping"). nam.edu
- Frontiers in Digital Health / PMC. (2025). "Secondary use under the European Health Data Space: setting the scene and towards a research agenda on privacy-enhancing technologies" (expert-interview study: non-granular opt-out, erosion of patient–doctor confidentiality, concern about commercial reuse and concentration among large firms). pmc.ncbi.nlm.nih.gov
- Pharmaceutical Commerce. "The Rise of GLP-1 Drugs and the Challenges of Proper Disposal" (millions of pens discarded yearly; disposal rules differ by region; many patients lack access to disposal routes and pens end in household waste; manufacturer take-back programmes exist but are not yet global). pharmaceuticalcommerce.com
- European Pharmaceutical Manufacturer. (2026). "Survey finds 96% ranks AI among top investment priorities" (survey of pharmaceutical supply chain professionals ahead of LogiPharma Digital Supply Chain Connect; regulatory uncertainty named the biggest barrier). pharmaceuticalmanufacturer.media
- World Economic Forum. (2024). "World Economic Forum Recognizes Leading Companies Transforming Global Manufacturing with AI Innovation" (AstraZeneca Wuxi: 34 4IR use cases; +55% output, –44% manufacturing lead time, –80% non-perfect batches, +54% labour productivity). weforum.org
- Dr. Reddy's Laboratories. "Manufacturing and supply" (WEF Global Lighthouse site, Bachupally, Hyderabad: 43% manufacturing cost improvement, 30% shorter production lead time, 41% lower energy consumption). drreddys.com
- DiCE – Digital Health in the Circular Economy. (2024). "Understanding Smart Collection, Its Significance and Necessity" (contributed by GRIN). circulardigitalhealth.eu
- GRIN. Company website. grin.no
- Osborne Clarke. (2026). “PPWR e settore farmaceutico: i chiarimenti delle FAQ della Commissione europea (marzo 2026)” [PPWR and the pharmaceutical sector: clarifications in the European Commission's FAQs]. osborneclarke.com
- Maine Department of Environmental Protection. (2026, 28 October). Stewardship Program for Packaging — program update bulletin. content.govdelivery.com
- DLA Piper. (2026, 3 September). “Federal court upholds Oregon's packaging EPR law in first-of-its-kind trial.” dlapiper.com
- Resource Productivity and Recovery Authority (RPRA), Ontario. “Blue Box Regulation.” rpra.ca
- European Union. (2017). Regulation (EU) 2017/745 on medical devices (MDR), including conformity-assessment provisions on changes to approved devices and quality management systems. Official Journal of the European Union, via EUR-Lex. eur-lex.europa.eu
- Healthcare Plastics Recycling Council (HPRC). (2023). “Design Guidelines for Optimal Hospital Plastics Recycling.” hprc.org
- Healthcare Plastics Recycling Council (HPRC). (2024, 28 February). “Healthcare Plastics Recycling Council Publishes Guiding Principles on Advanced Recycling.” Via 3BL. 3blmedia.com
- NHS England. (2024). “Greener NHS: Net Zero Supplier Roadmap.” england.nhs.uk
- NHS Supply Chain. (2026). “Behind the scenes of packaging compliance: the foundation for greener NHS procurement.” supplychain.nhs.uk
- DuPont. “Delivering Sustainable Innovation for Sterile Packaging” (Olympus case study; company-reported). dupont.com
- Greyparrot. “Greyparrot and Kenvue collaborate to help accelerate circular packaging” (company announcement). greyparrot.ai
- SkyCell. “Redefining pharma logistics: MIT CTL's breakthrough in carbon reduction” (company blog; SkyCell's application of the MIT CTL tool). blog.skycell.ch
- Vinyl Council of Australia. (2022). “Vinyl Council of Australia's PVC Recycling in Hospitals program expands in regional areas.” vinyl.org.au
- SCHOTT Pharma. (2026, 7 September). “SCHOTT Pharma, Takeda and Corplex bring closed-loop recycling system for pharmaceutical vial trays” (media release). schott-pharma.com
- Alliance to End Plastic Waste. (2025). “Digital watermark technology demonstrates effectiveness in HolyGrail 2.0 industrial trials on real post-household rigid packaging waste.” endplasticwaste.org
- PVC Europe. “PVC applications: packaging” (includes VinylPlus PharmPack; industry-reported). pvc.org
- Healthcare Plastics Recycling Council (HPRC) & Plastics Industry Association. “Chicago Regional Recycling Project: Final Report.” hprc.org
- Healthcare Plastics Recycling Council (HPRC). (2024). “Medical Plastics Recycling Pilot Report” (B. Braun Medical, Lehigh Valley Health Network and PureCycle Technologies). hprc.org
- O'Melveny & Myers. (2026, 30 April). “2026 Plastics EPR & Packaging Rules Update: What SB 54, SB 343, State Reporting Deadlines, PRC Laws, & the EU PPWR Mean for Producers & Retailers.” omm.com
- Zenpack. (2026, updated 27 July). “US EPR Packaging Compliance Guide (2026 update).” zenpack.us
- ERIA Regional Knowledge Centre for Marine Plastic Debris. “Extended Producer Responsibility: legal framework — Japan.” rkcmpd-eria.org
- Government of Japan. (2022, May). “Concerning the Act on Promotion of Resource Circulation for Plastics.” Highlighting Japan. gov-online.go.jp
- ABC News. (2026, 8 September). “Labor quietly shelves promise to mandate more recycled material in packaging.” abc.net.au
- plastics.org.au. (2026). “Australia's Packaging Recycling Reform Changes Direction.” plastics.org.au
- Packaging Insights. (2026, 9 September). “EPR in Latin America: Regulatory momentum meets fragmented implementation.” packaginginsights.com
- KPMG. (2024). “From shelf to self: Consumers are taking charge of their health.” Cites YouGov (2023) survey of US adults on over-the-counter purchase drivers. kpmg.com
- McKinsey & Company. (2025, 4 June). “Do US consumers care about sustainable packaging in 2025?” mckinsey.com
- Lorenzini, G. C., & Olsson, A. (2021). “Exploring How and Why to Develop Patient-Centered Packaging: A Multiple-Case Study with Pharmaceutical Companies.” Therapeutic Innovation & Regulatory Science. doi:10.1007/s43441-021-00338-0. pmc.ncbi.nlm.nih.gov
- U.S. Code of Federal Regulations. 21 CFR 211.94, “Drug product containers and closures.” eCFR. ecfr.gov
- U.S. Code of Federal Regulations. 21 CFR Part 820, device quality management and packaging controls. eCFR. ecfr.gov
- Government of Ontario. Ontario Regulation 391/21, Blue Box. ontario.ca
- Arnold & Porter. (2026, 27 July). “The EU Packaging and Packaging Waste Regulation: Why Life Sciences Companies Should Act Now.” BioSlice Blog. biosliceblog.com
- European Commission. “Packaging and Packaging Waste Regulation — implementation.” Green Forum. green-forum.ec.europa.eu
- Defra and PackUK. (2026, updated 29 October). “Extended producer responsibility for packaging.” GOV.UK. gov.uk
- HMRC. “Check which plastic packaging is exempt from Plastic Packaging Tax.” GOV.UK. gov.uk
- HMRC. (2026, updated 12 February). “Check if you need to register for Plastic Packaging Tax.” GOV.UK. gov.uk
- Emirates News Agency (WAM). (2025, 3 July). “MOCCAE collaborates with Tadweer Group to launch targeted-waste EPR pilot.” wam.ae
- ESGweise. (2026, updated 23 October). “UAE Extended Producer Responsibility (EPR) 2026.” esgweise.com
- Republic of South Africa. (2021, 5 May). Government Notice 400, Gazette 44539: amendments to the Extended Producer Responsibility Regulations. gov.za
- Republic of South Africa. (2023, 5 May). Government Notice 3388, Gazette 48527: proposed amendments to the Extended Producer Responsibility Regulations. dffe.gov.za
- State of Oregon. Oregon Revised Statutes chapter 459A (covered products and producer responsibility). oregonlegislature.gov
- Oregon Department of Environmental Quality. “Recycling Modernization Act: producer exemptions.” oregon.gov
- State of Oregon. OAR 340-090-0840, covered-product exclusions (current rule, including temporary amendments). sos.state.or.us
- State of California. 14 CCR § 18980.2, medical-product and packaging exclusions (final SB 54 regulations). govt.westlaw.com
- CalRecycle. “SB 54 packaging EPR implementation and programme-plan status.” calrecycle.ca.gov
- U.S. Code of Federal Regulations. 21 CFR 314.70, “Supplements and other changes to an approved NDA.” eCFR. ecfr.gov
- Government of Canada. (2026, 14 March). Canada Gazette, Part I: Federal Plastics Registry notice amendment and notice of intent. gazette.gc.ca
- Ministry of Ecology and Environment of the People's Republic of China. (2026). Ecological and Environmental Code. mee.gov.cn
- Government of India. (2022). Plastic Waste Management (Amendment) Rules, 2022, G.S.R. 133(E). cpcb.gov.in
- Government of India. (2026). Plastic Waste Management (Amendment) Rules, 2026, G.S.R. 237(E). egazette.gov.in
- Government of India. (2016). Bio-Medical Waste Management Rules, 2016, G.S.R. 343(E). egazette.gov.in
- Government of Japan. Containers and Packaging Recycling Act (Act No. 112 of 1995). e-Gov. laws.e-gov.go.jp
- Ministry of Economy, Trade and Industry (METI), Japan. Containers and Packaging Recycling Law: operational guide. meti.go.jp
- Australian Government DCCEEW. (2026, updated 23 October). “Strengthening packaging regulation.” dcceew.gov.au
- Federative Republic of Brazil. (2025, 21 October). Decree No. 12,688 (plastic-packaging reverse logistics). planalto.gov.br
- Brazil Ministry of Environment and Climate Change (MMA). (2026). Corrected implementation communication LR DGR/MMA No. 002/2026 (non-binding guidance). sinir.gov.br
- Federative Republic of Brazil. (2020, 5 June). Decree No. 10,388 (household medicines and their packaging). planalto.gov.br
- Republic of Chile. Supreme Decree 12/2020 on packaging collection and recovery targets. bcn.cl
- Republic of Colombia. (2024, 24 June). Resolution 803 of 2024 amending Resolution 1407 of 2018 (packaging EPR). cancilleria.gov.co
- Jackman et al. (2025). “Global Innovations in Sustainable Pharmaceutical Packaging in the Last 25 Years: A Scoping Review.” Sustainability, 17(23), 10716. mdpi.com
- PPWR Connect. (2026, 15 May). “PPWR & Pharmaceutical Blister Converters: PVC Phase-Out, Mono-PP & Mono-PET, Aclar Barriers” (industry blog). ppwrconnect.com
- Packaging Europe. (2022, 25 April). “‘First-to-market’ mono-material PET blister lid unveiled by Huhtamaki.” packagingeurope.com
- Polyestertime. (2026, 10 August). “Chemical recycling costs: stark EU warning” (on European Commission JRC, Economic viability of chemical recycling, July 2026). polyestertime.com
- World Health Organization. (2002). Technical Report Series 902, Annex 9: Guidelines on packaging for pharmaceutical products. who.int
- Paper World. (2026, 22 May). “Faller Packaging and Harvest Packaging: Practical trays for the pharmaceutical industry” (supplier-reported). paper-world.com
- Pharmaceutical Commerce. (2011, 20 June). “Making pallets a supply-chain asset instead of an unrecoverable cost” (written by a pallet-pooling provider). pharmaceuticalcommerce.com
- Packaging Dive. (2024, 18 November). “Ellen MacArthur Foundation progress report: signatories to miss 2025 targets” (Global Commitment 2024 data; reusables 1.3% of signatories' packaging). packagingdive.com
- ICIS. (2026, 20 February). “EU mass balance accounting rules under SUPD revealed.” icis.com
- ESM Magazine. (2026, 9 July). “Flexible Packaging Europe sees raw-material prices surge in Q2 2026” (Flexible Packaging Europe Raw Material Price Index). esmmagazine.com
- Deloitte Center for Health Solutions. (2026, 26 May). “Life sciences execs show resilience to tariffs, policy changes” (survey of 120 pharmaceutical and medtech executives, April 2026). deloitte.com
- Datwyler. (2025). “Dual sourcing for pharmaceutical packaging” (supplier trend report). healthcare.datwyler.com
- ENKORE. “ENKORE community” (public-private partnership, life sciences industry and the EU). enkoreecohealthcare.eu
- European Commission. “National rules on reprocessing of single-use devices.” health.ec.europa.eu
- Vanguard. (2025). “The Netherlands allows CS reprocessing from the turn of the year.” vanguard.de
- European Commission. (2025). “Ecodesign for Sustainable Products and Energy Labelling Working Plan 2025–2030,” COM(2025) 187. data.consilium.europa.eu
- Swiss Federal Council. (2026, 24 June). “Bundesrat stärkt Recycling bei Verpackungen und Abfällen” (press release; new Packaging Ordinance, VerpV). admin.ch
- be circular. (2026). “Post-container automated sorting of clinical waste: prototype and engineering pre-project.”
- be circular. (2026). “Expired-stock recovery and surface restoration of instrument components.”